IT and software
From collection to delivery
Where data goes from collection through transformation, storage and aggregation to display, and what kind of container holds it at each step
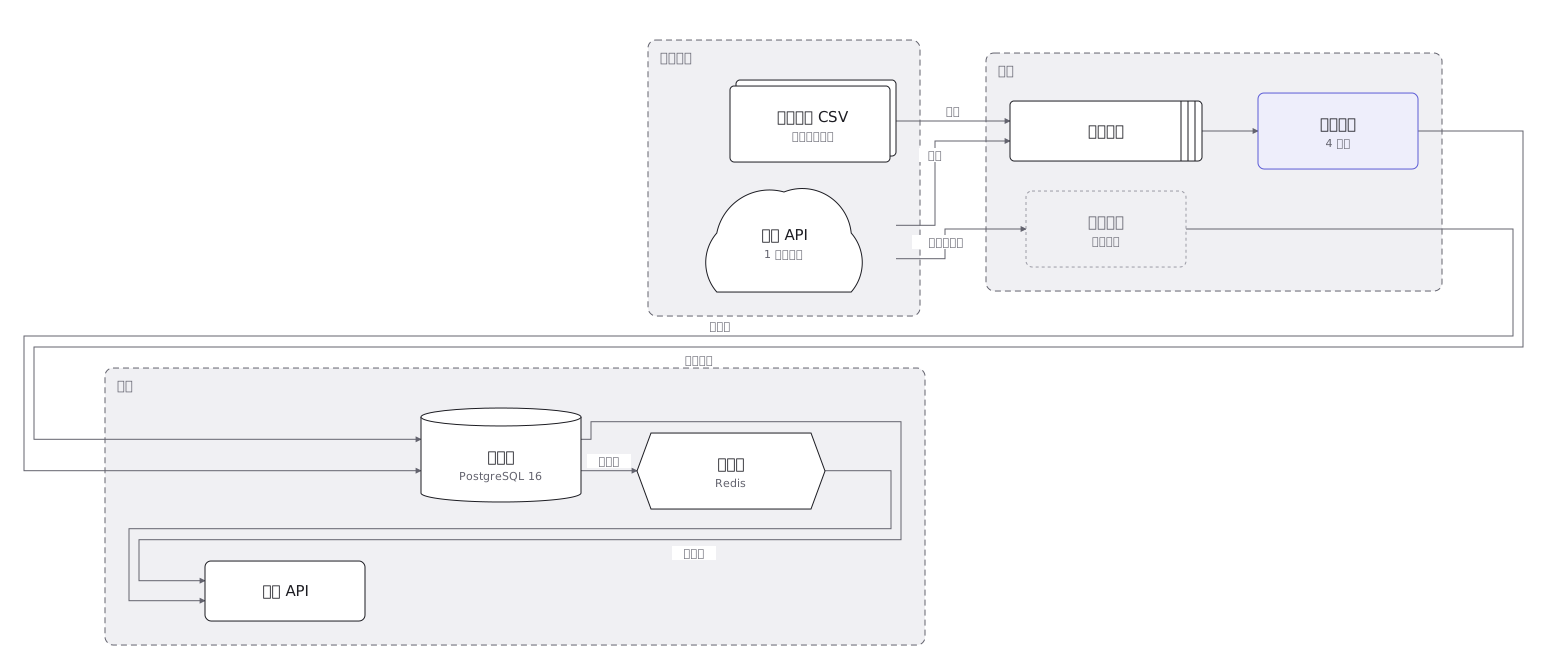
This drawing comes from one YAML file. No shape was moved by hand.
Notes in the source (in Japanese)
データフロー図で数えるのは、箱ではなく「入口」。外部 API と手上げの CSV —— 入口が 2 つある時点で、形の違う 2 種類が入ってくる。
新しいワーカーができても、旧バッチが止まるまでは両方が同じ集約先へ書く。移行中の期間こそ、図が要る。 片方だけ描くと、二重書き込みが見えない。旧バッチにも入口の線を描く。入力の無い処理は、データフロー図では「どこからともなく出力が出る」誤り(奇跡の処理、miracle)として数える。
キューは「そこに溜まる」ので、詰まったときに何が起きるかを図から読む。入る速さと出る速さが釣り合わない所が、いつも事故になる。
Source (YAML)
examples/gallery/03-データの流れ.zumen.yaml
More in this field
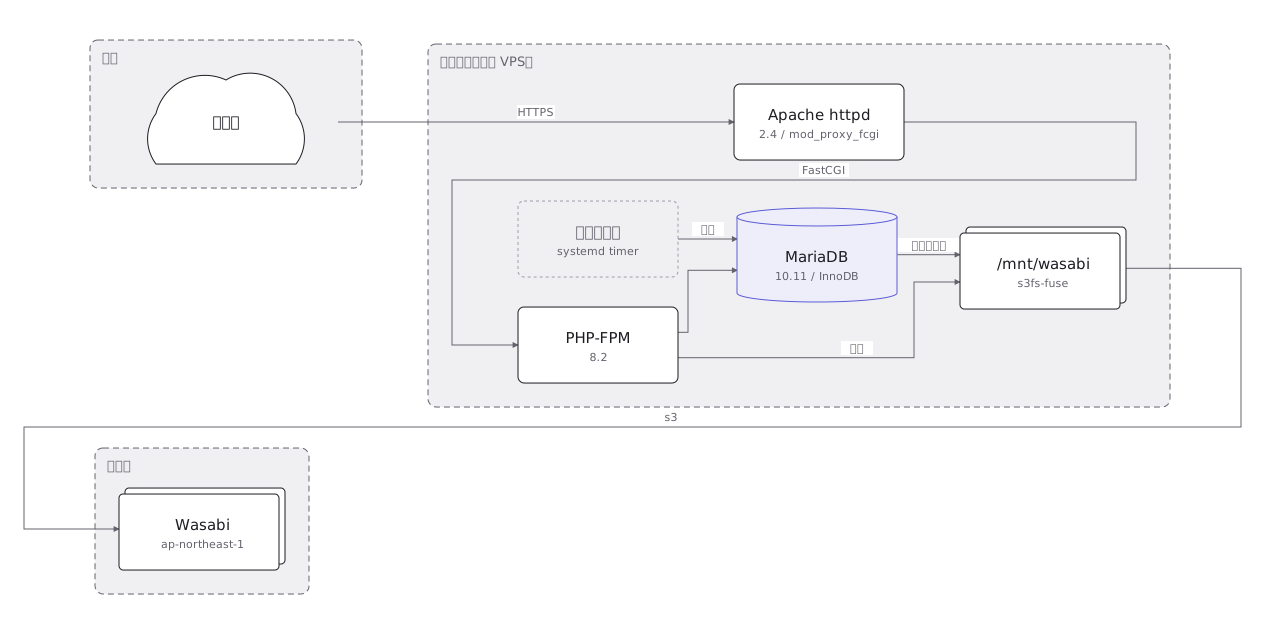 An on-premise server layout rack by rack, with the redundant power feeds and network links drawn as separate paths
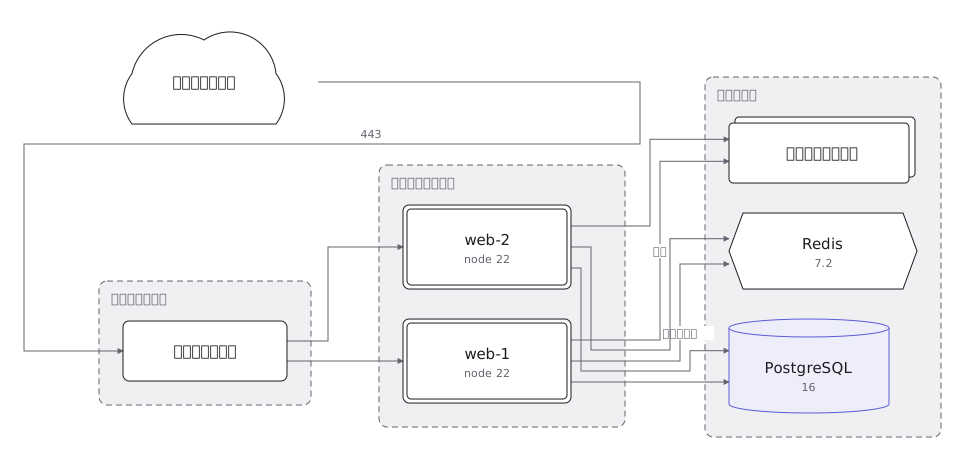 A cloud architecture showing the VPC and its subnets, and where the load balancer, application, database and object store sit
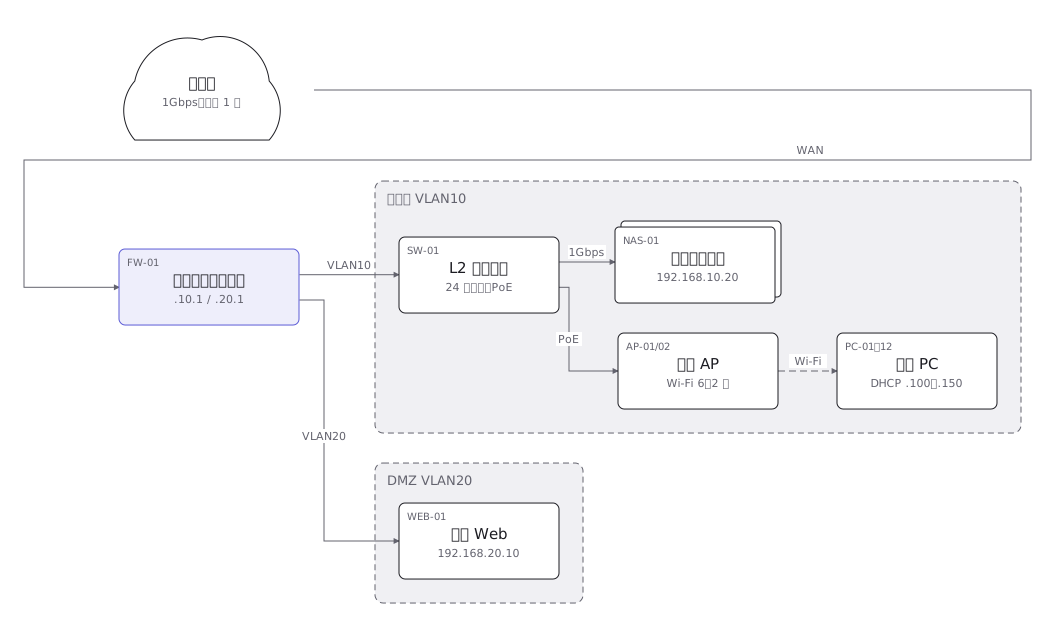 A network layout of the links and equipment between sites, with the address range carried by each segment
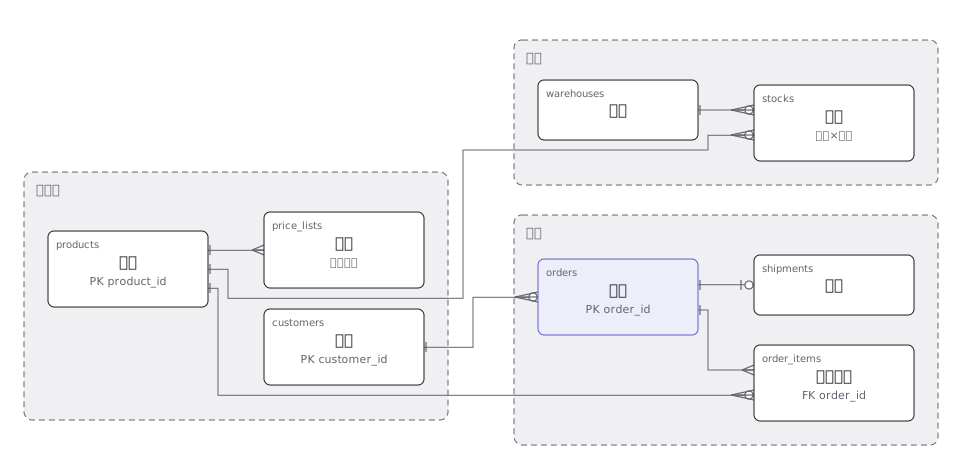 An order management ER diagram with primary and foreign keys, and the one-to-many relationships drawn as crow feet
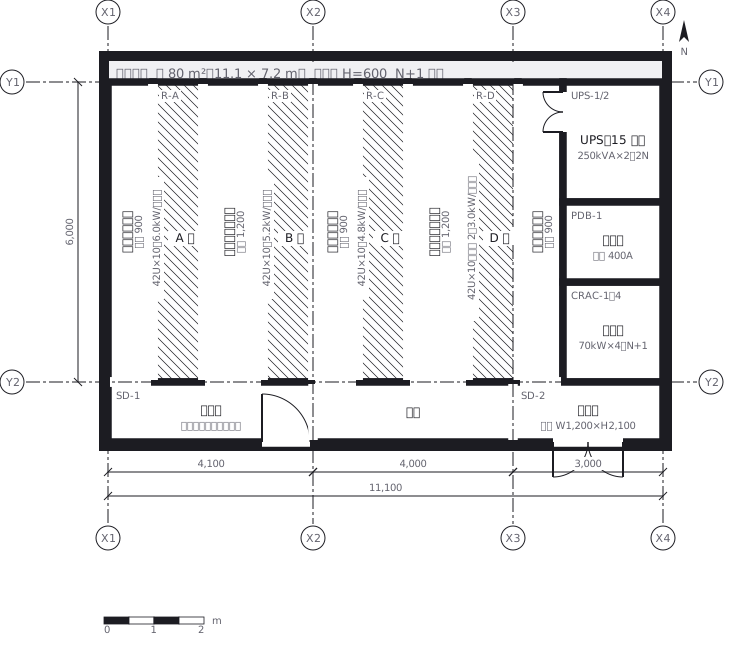 A server room where racks face each other to make hot and cold aisles, with the clearance of each aisle written in
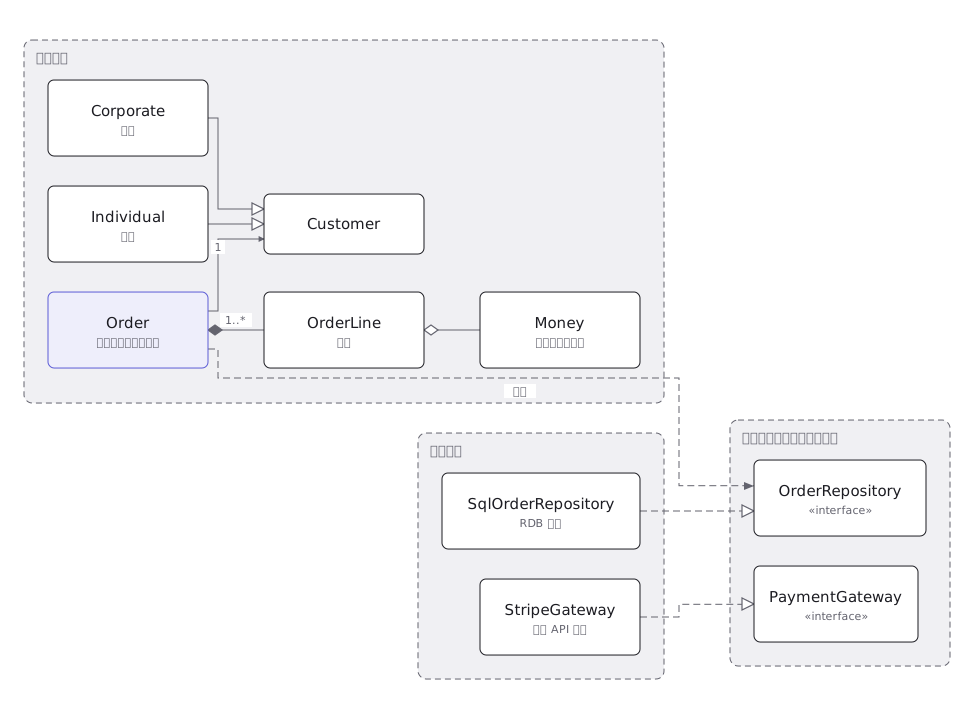 A UML class diagram where inheritance, realisation, association and aggregation are told apart by line type and end symbol
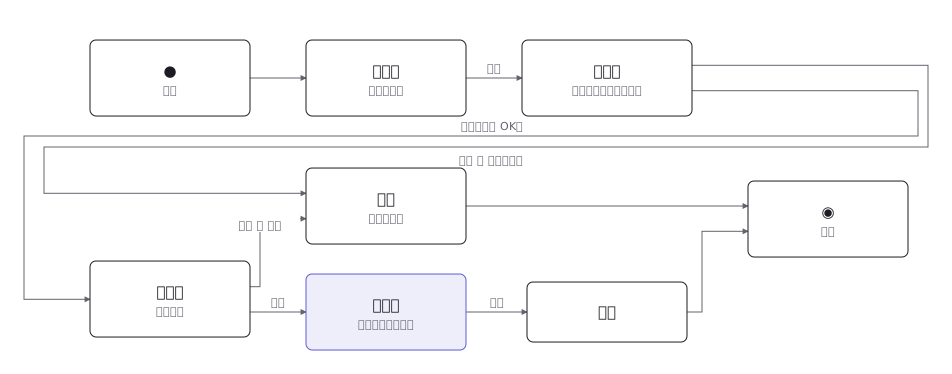 A UML state machine with transitions, the events and guards that fire them, and the pseudostates that begin and end it
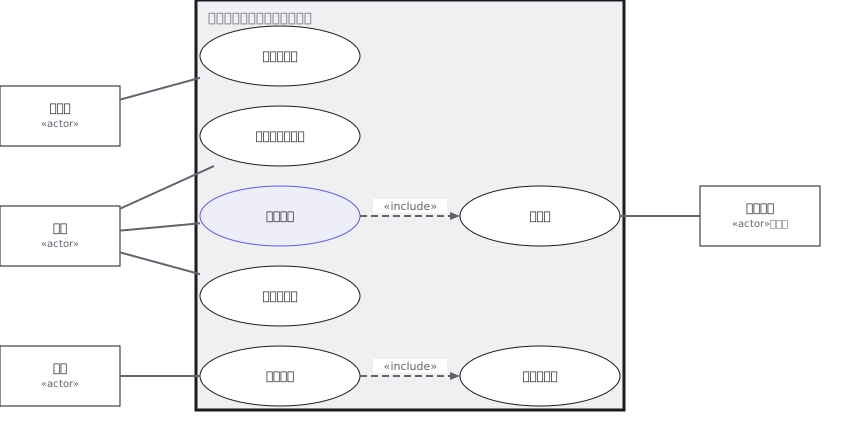 A UML use case diagram with the actors, the use cases, and the include and extend relationships between them