Transit and transport
Fictional railway main line train graph (diagram, weekday morning 6:00 to 9:00)
A train graph with time across and stations down, where every train becomes a single sloping line and the slope is its speed
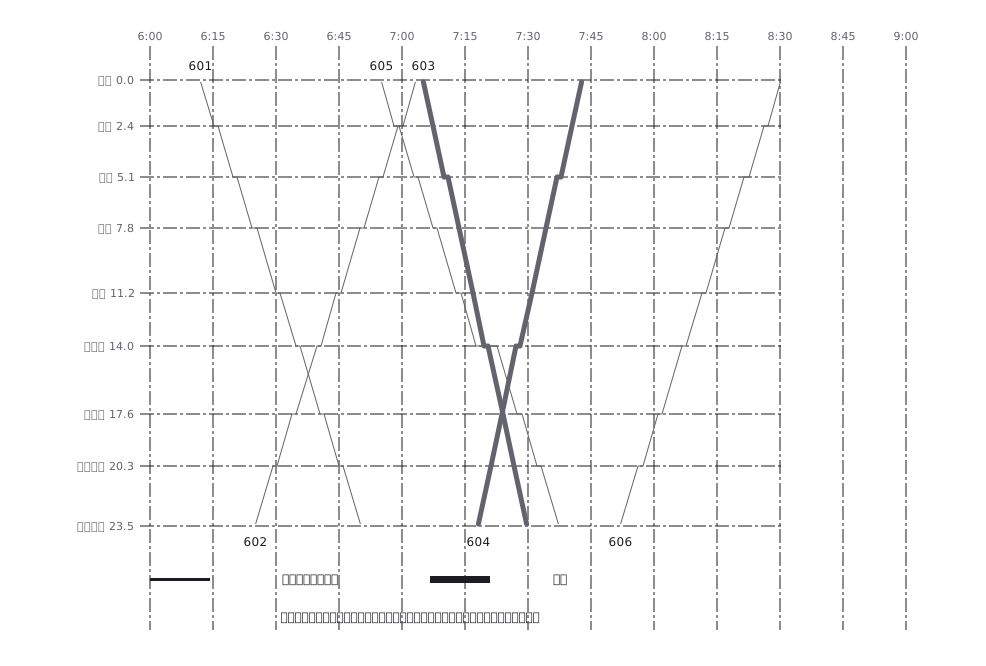
This drawing comes from one YAML file. No shape was moved by hand.
Notes in the source (in Japanese)
縦が駅、横が時刻。駅の間隔は営業キロに比例させてある ——だから線の傾きがそのまま速度になり、特急が普通を追い抜く様子が目で分かる。右下がりが下り(港町 → 海浜公園)、右上がりが上り。駅で水平になっている短い区間が停車時間。空港前で 605 が 603 を待避する。停車駅は見本 52(停車駅案内図)の特急と同じ(中央・空港前)。下りは奇数、上りは偶数の列車番号。列車番号は線の端(起点側)に置く —— 実物のダイヤもそこに書く。
Source (YAML)
examples/gallery/71-列車運行図表.zumen.yaml
More in this field
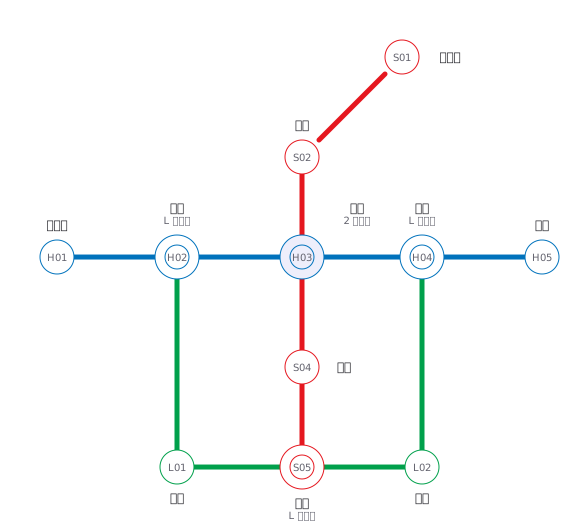 A fictional transit map of three lines told apart by colour and station numbering, drawn only in horizontal, vertical and 45° segments, with interchange stations marked by a double circle
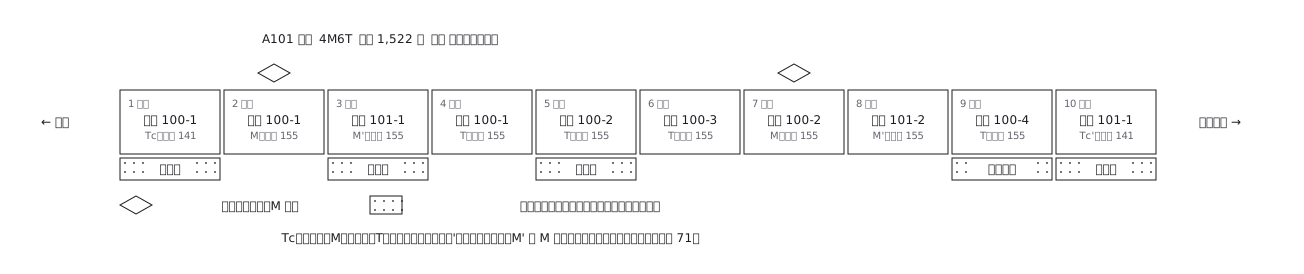 A ten-car commuter train set out car by car: which are motored and which are trailers, where the pantographs are, and what each car carries inside
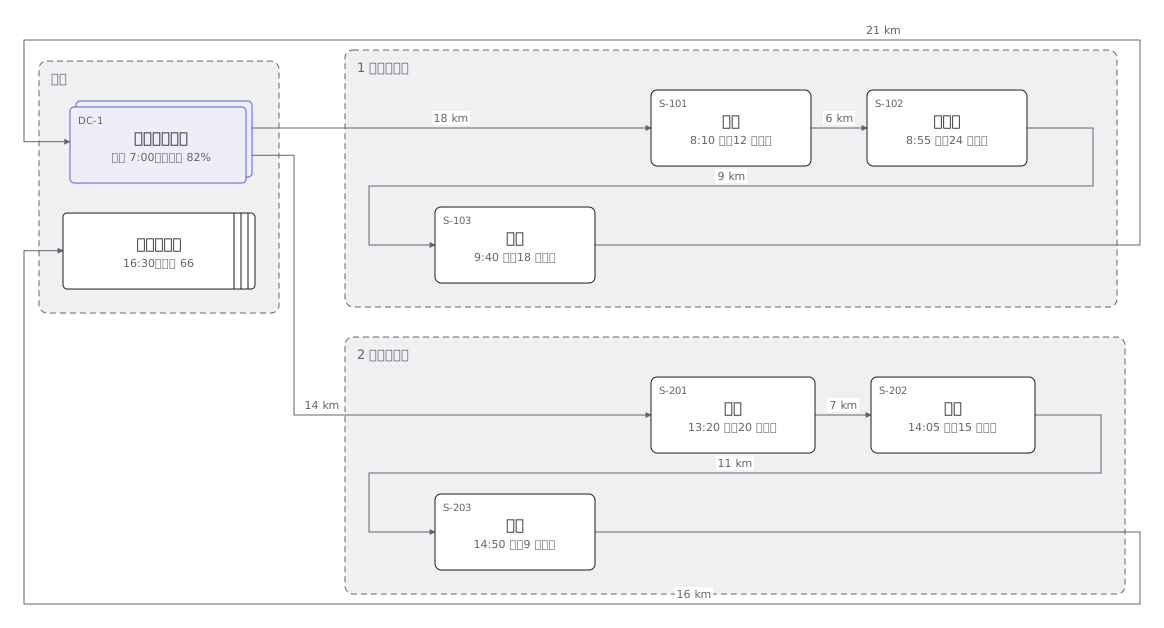 Delivery rounds for one two-tonne van split into a morning and an afternoon run: the order of calls and the stops themselves
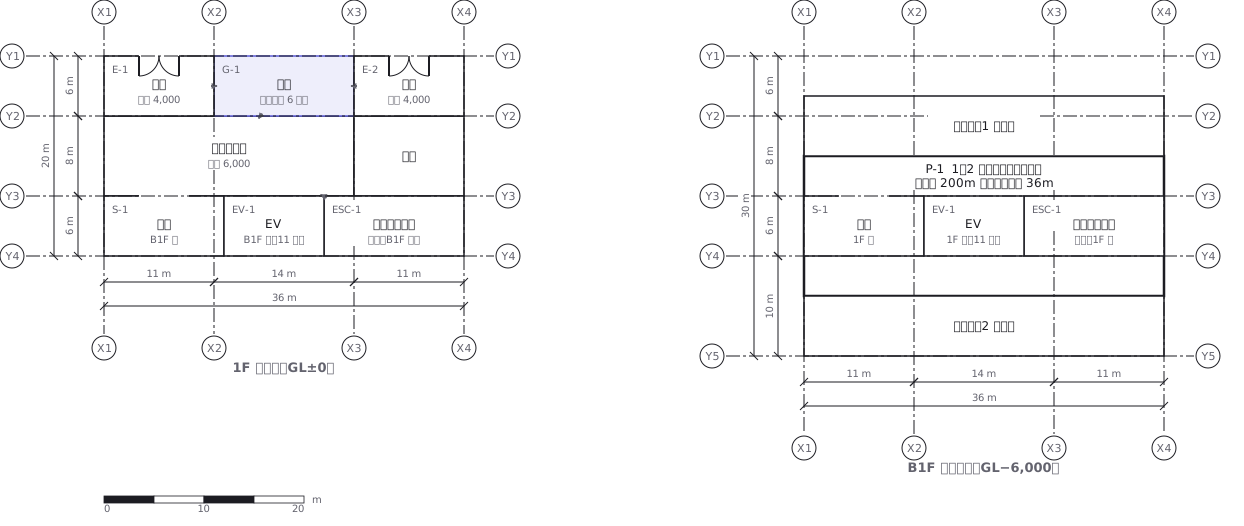 A station on two levels — ground floor and concourse — showing how the gates, stairs, lifts and exits line up with each other
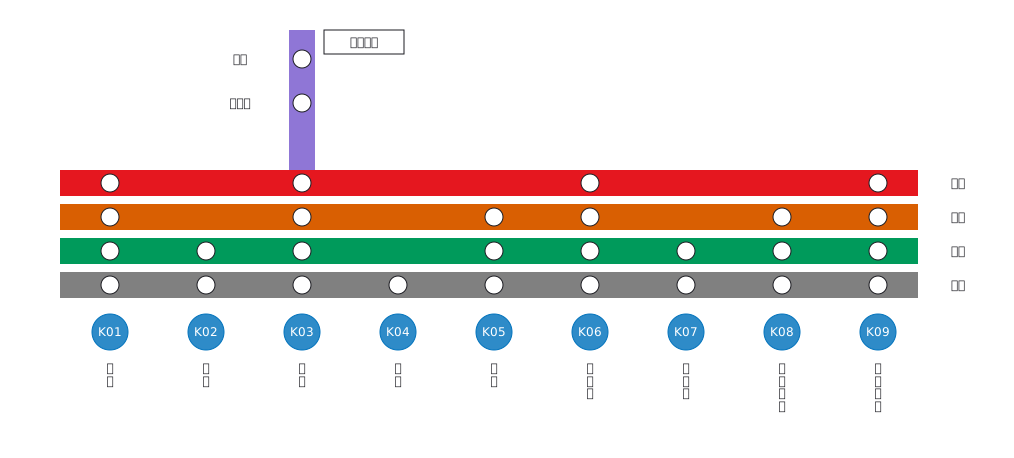 Stopping pattern chart: a band per service, a circle per stop
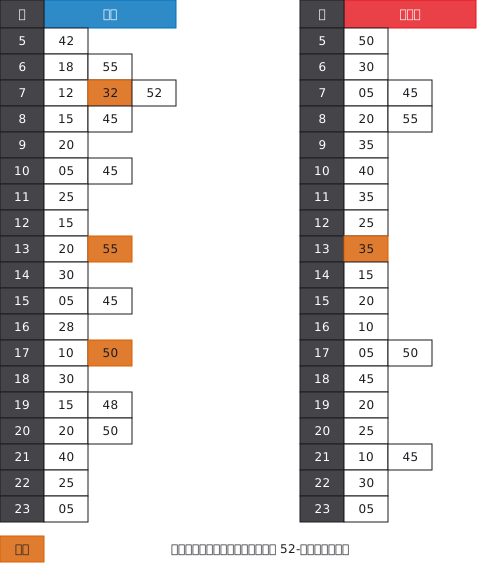 A station timetable with hours down the side and minutes across, weekday and weekend separated, and train types shown by symbol
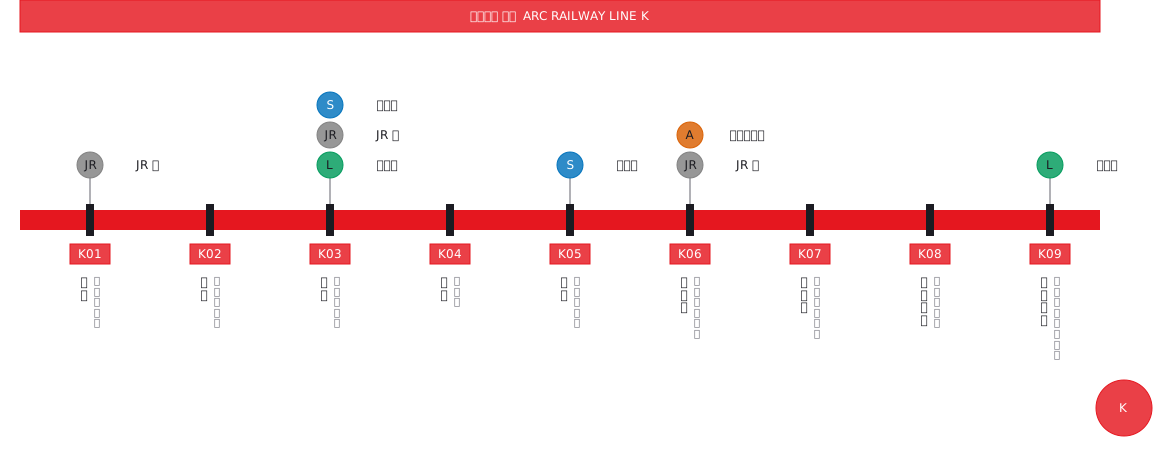 Interchange guide with station names set vertically
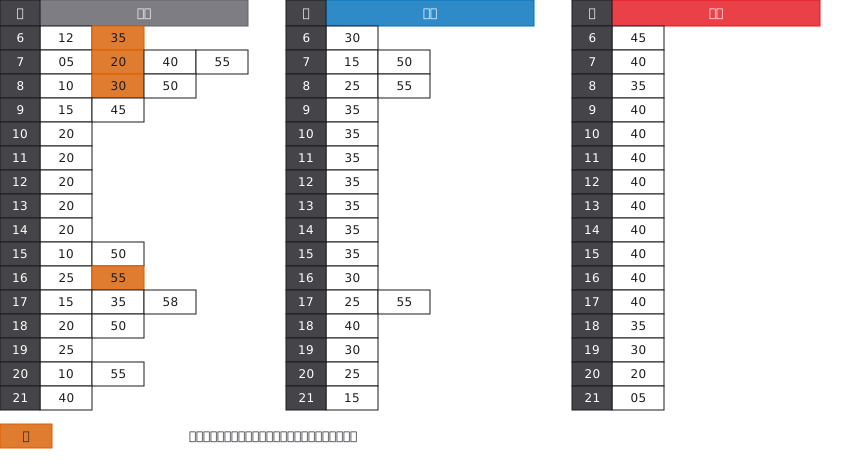 A bus stop timetable in three columns — weekday, Saturday, Sunday and holiday — with the departure minutes listed under each hour