Services and electrical
Transmission line profile (275 kV — fictional)
A transmission line profile: the wire sags, and the towers are sized so it still clears
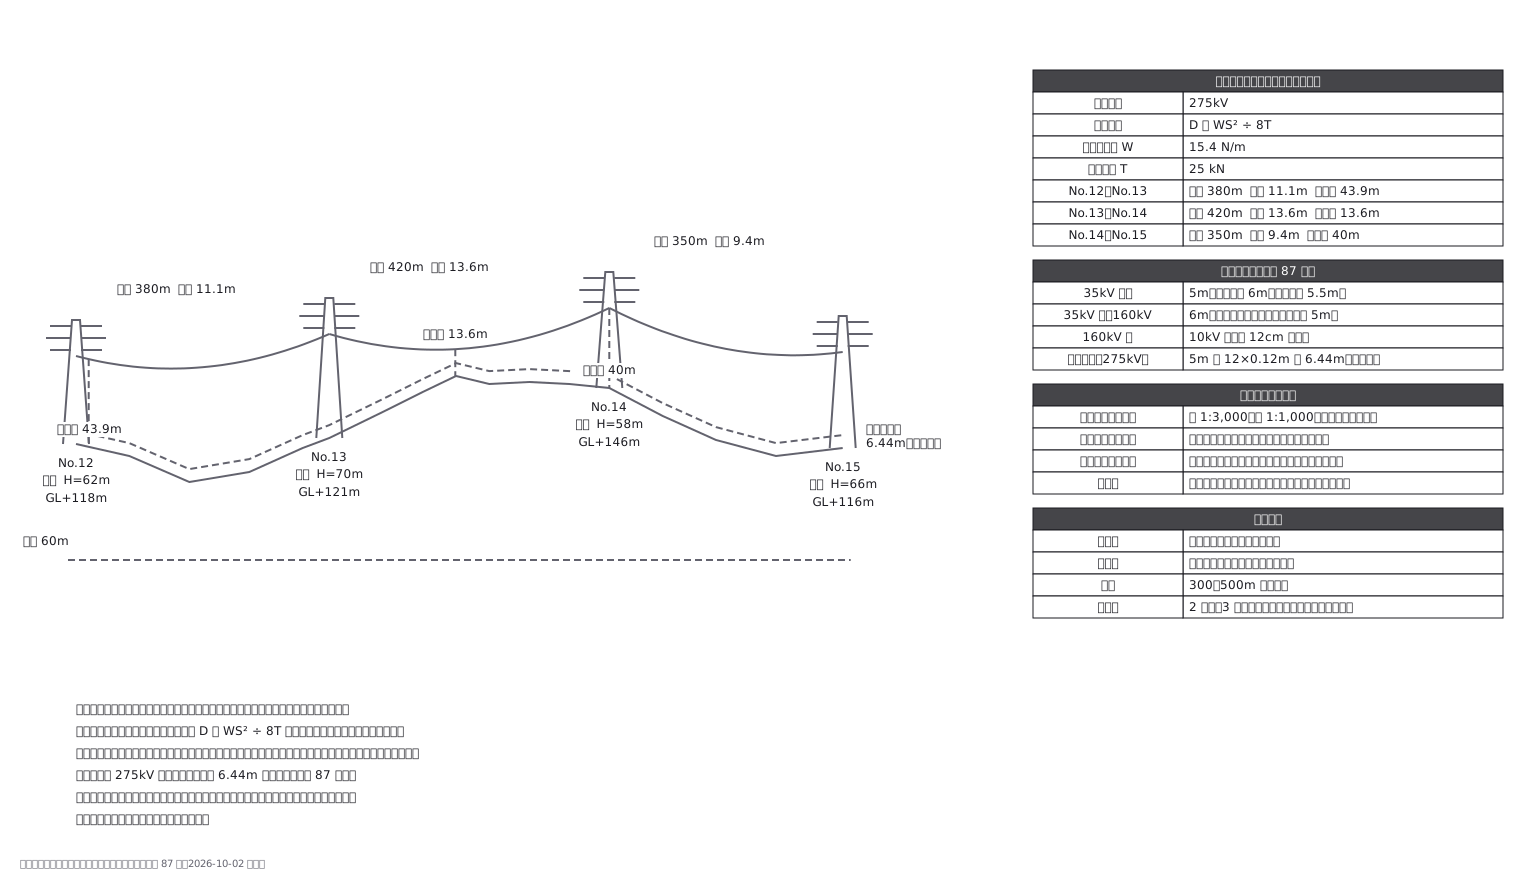
This drawing comes from one YAML file. No shape was moved by hand.
Notes in the source (in Japanese)
プロフィール図。 送電線が地面からどれだけ離れているかを見る図。
縦横で縮尺が違う(横 1:3,000/縦 1:1,000)。縦を強調しないと、50m ほどの起伏が 1,150m の中で潰れて読めない —— だから \scale\ は書かない(1 つしか持てない縮尺を書くと、もう片方が嘘になる)。同じ理由で斜めの寸法線を引かない。長さは数字で書く。
弛度は D = WS² ÷ 8T(W 電線の重量・S 径間・T 水平張力)。径間が延びると二乗で増える。 いちばん垂れるのは最高気温・無風のときで、そのときに最低地上高を満たすように鉄塔の高さを決める。
最低地上高は解釈 87 条(87-2 表)。160kV を超える分は 10kV ごと(端数は切り上げ)に 12cm を足す。出典:経済産業省「電気設備の技術基準の解釈」第 87 条https://www.meti.go.jp/policy/safety_security/industrial_safety/law/files/dengikaishaku.pdf (取得 2026-10-02)この図の弛度・地上高は、W・T・径間から計算した(手で書いていない)。
Source (YAML)
examples/gallery/174-送電線路の縦断面図.zumen.yaml
More in this field
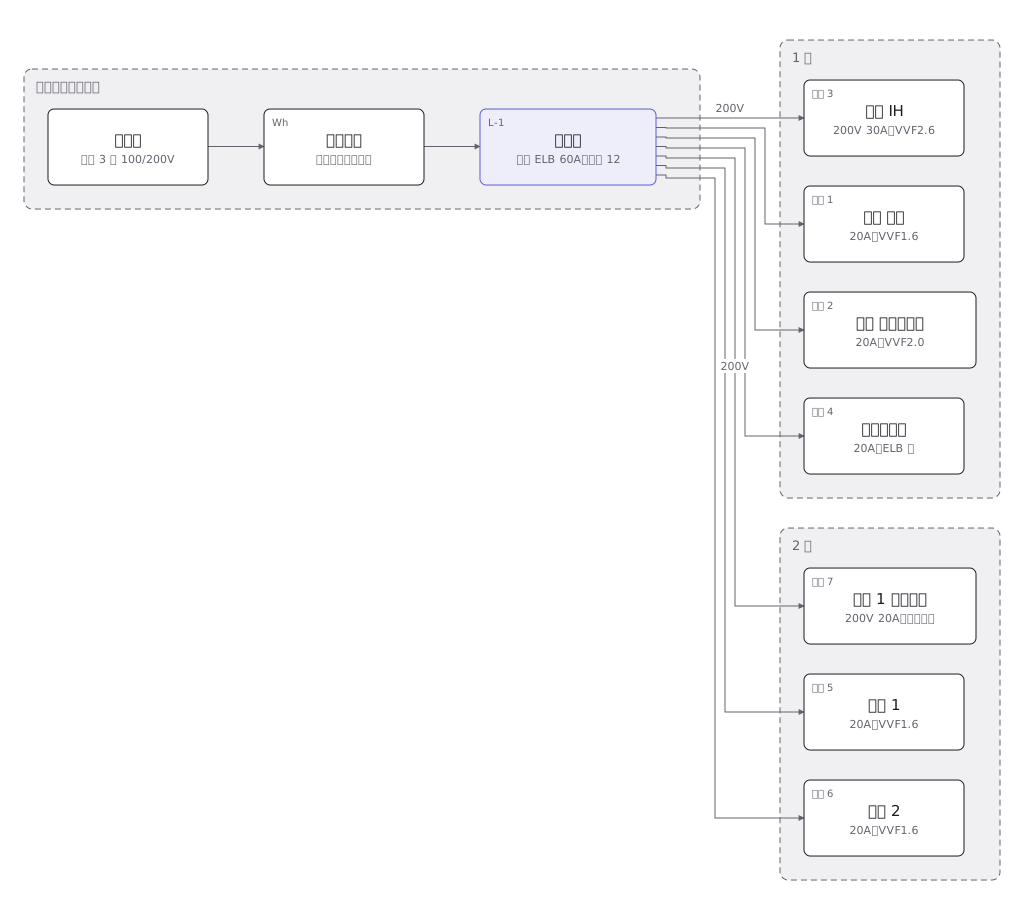 A house wiring layout from the service entrance to the consumer unit, then breaker by breaker to the sockets and lights in each room
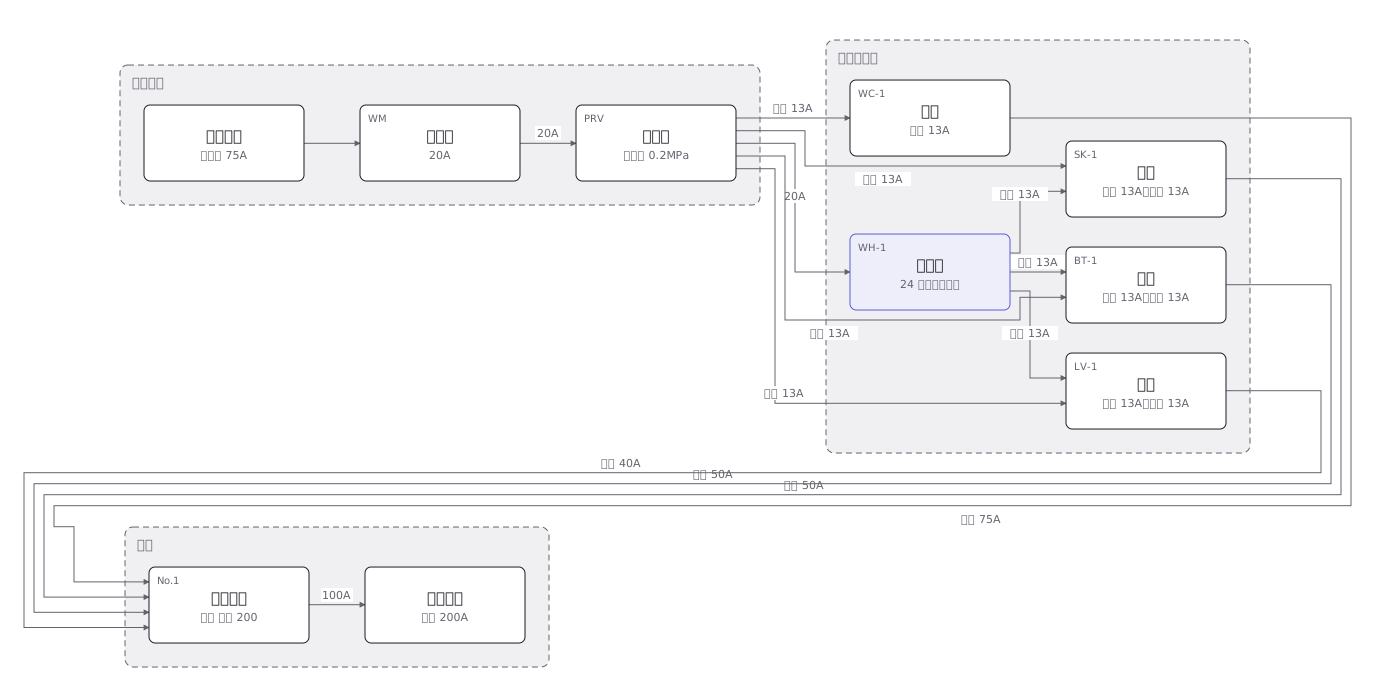 The four plumbing systems of a house — cold supply, hot supply, drainage and venting — separated out fixture by fixture
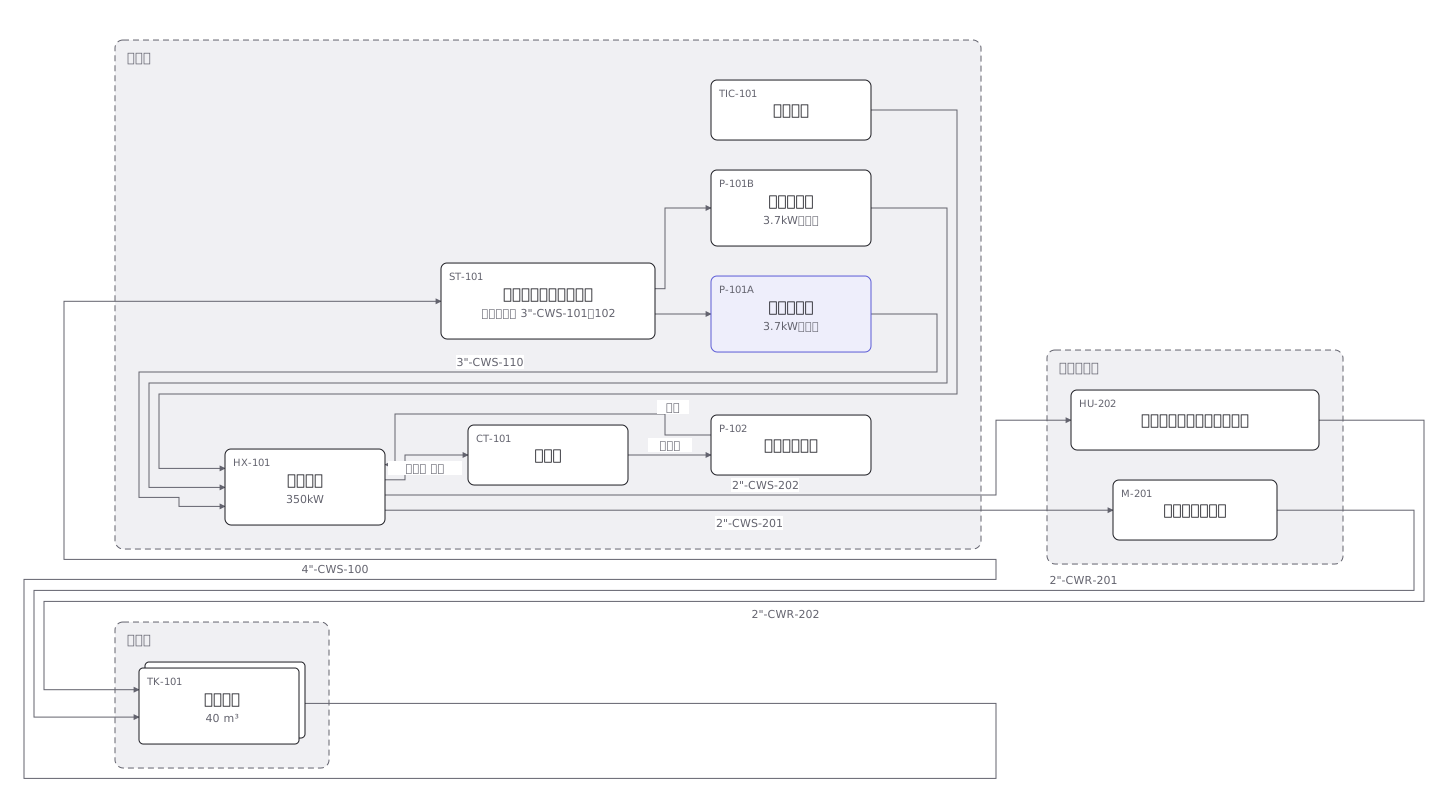 A cooling water P&ID where pumps, heat exchangers, valves and instruments are joined by pipes distinguished by line type
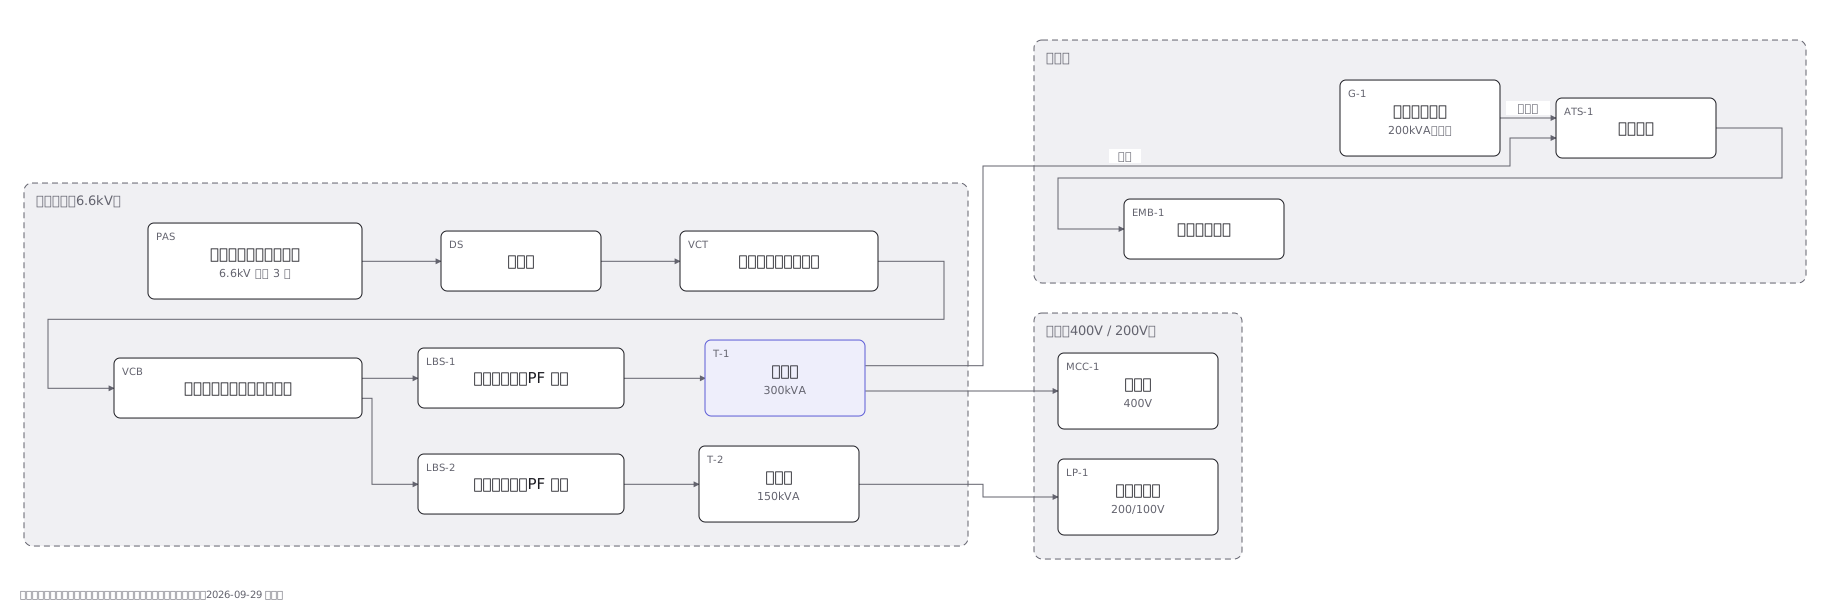 A substation single-line diagram from the incoming supply through disconnector, breaker and transformer to the low voltage boards
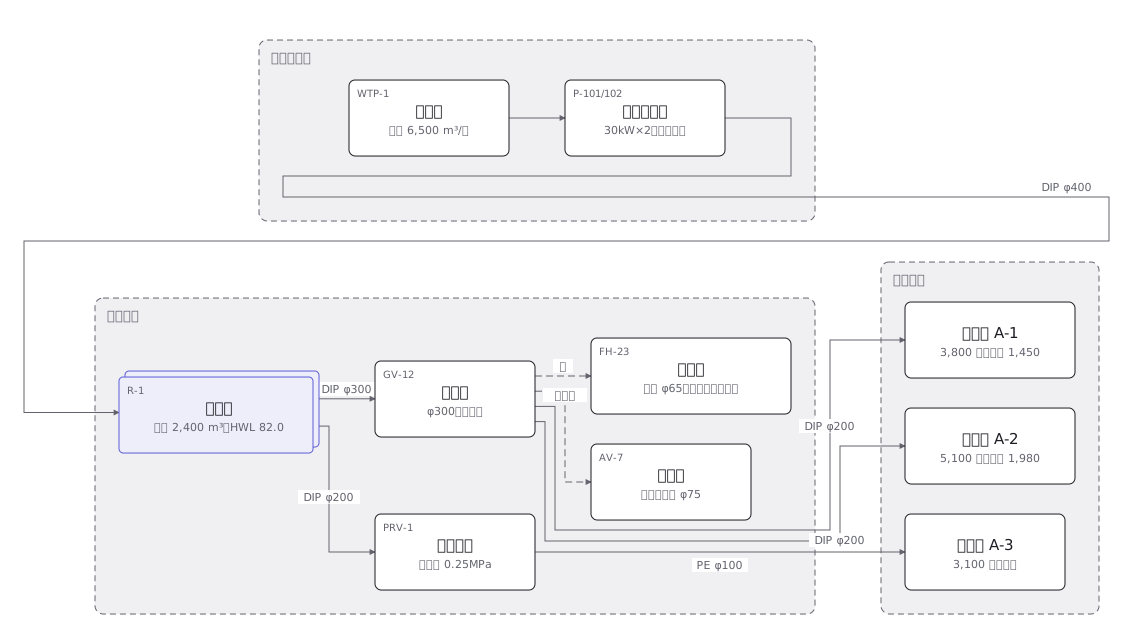 A town water distribution network from treatment works through service reservoirs and trunk mains to each supply zone, with the ground level of every zone
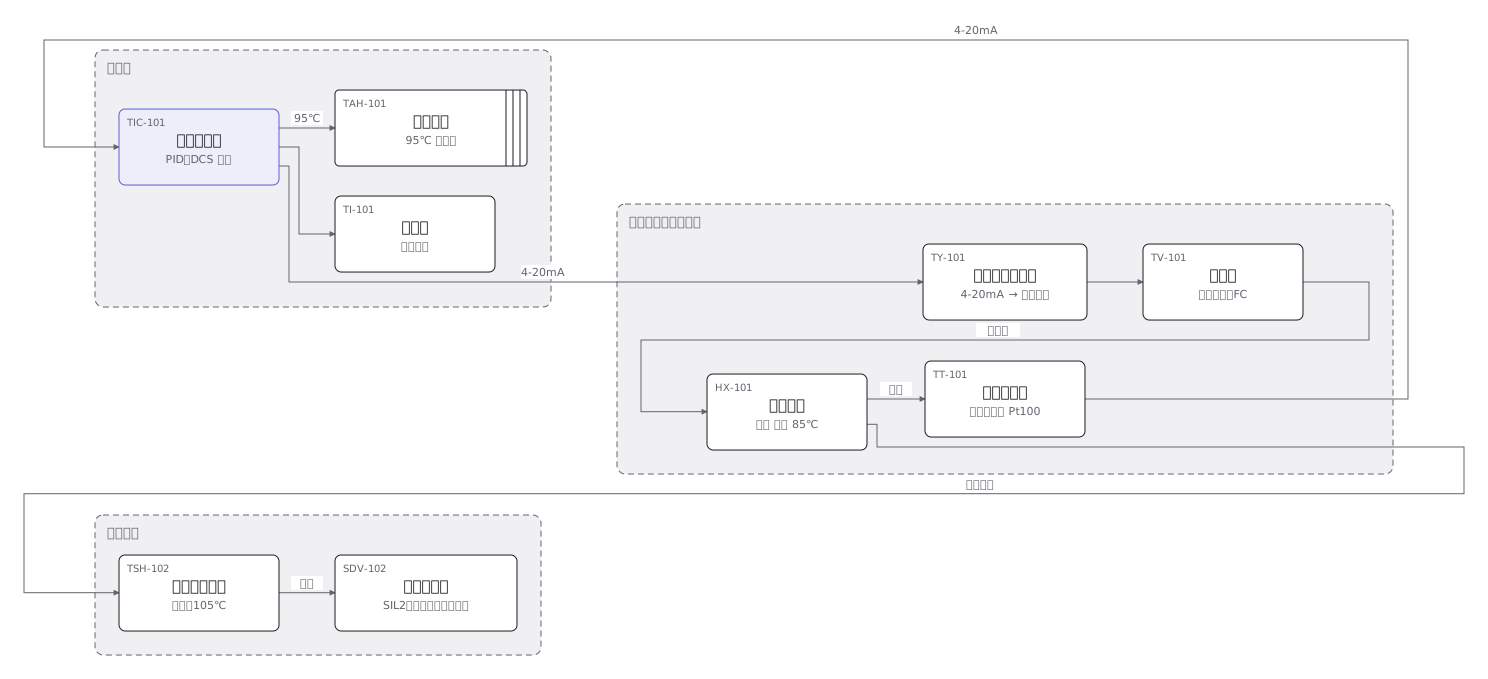 An instrument loop from sensing element through transmitter and controller to final element, every device carrying its ISA tag
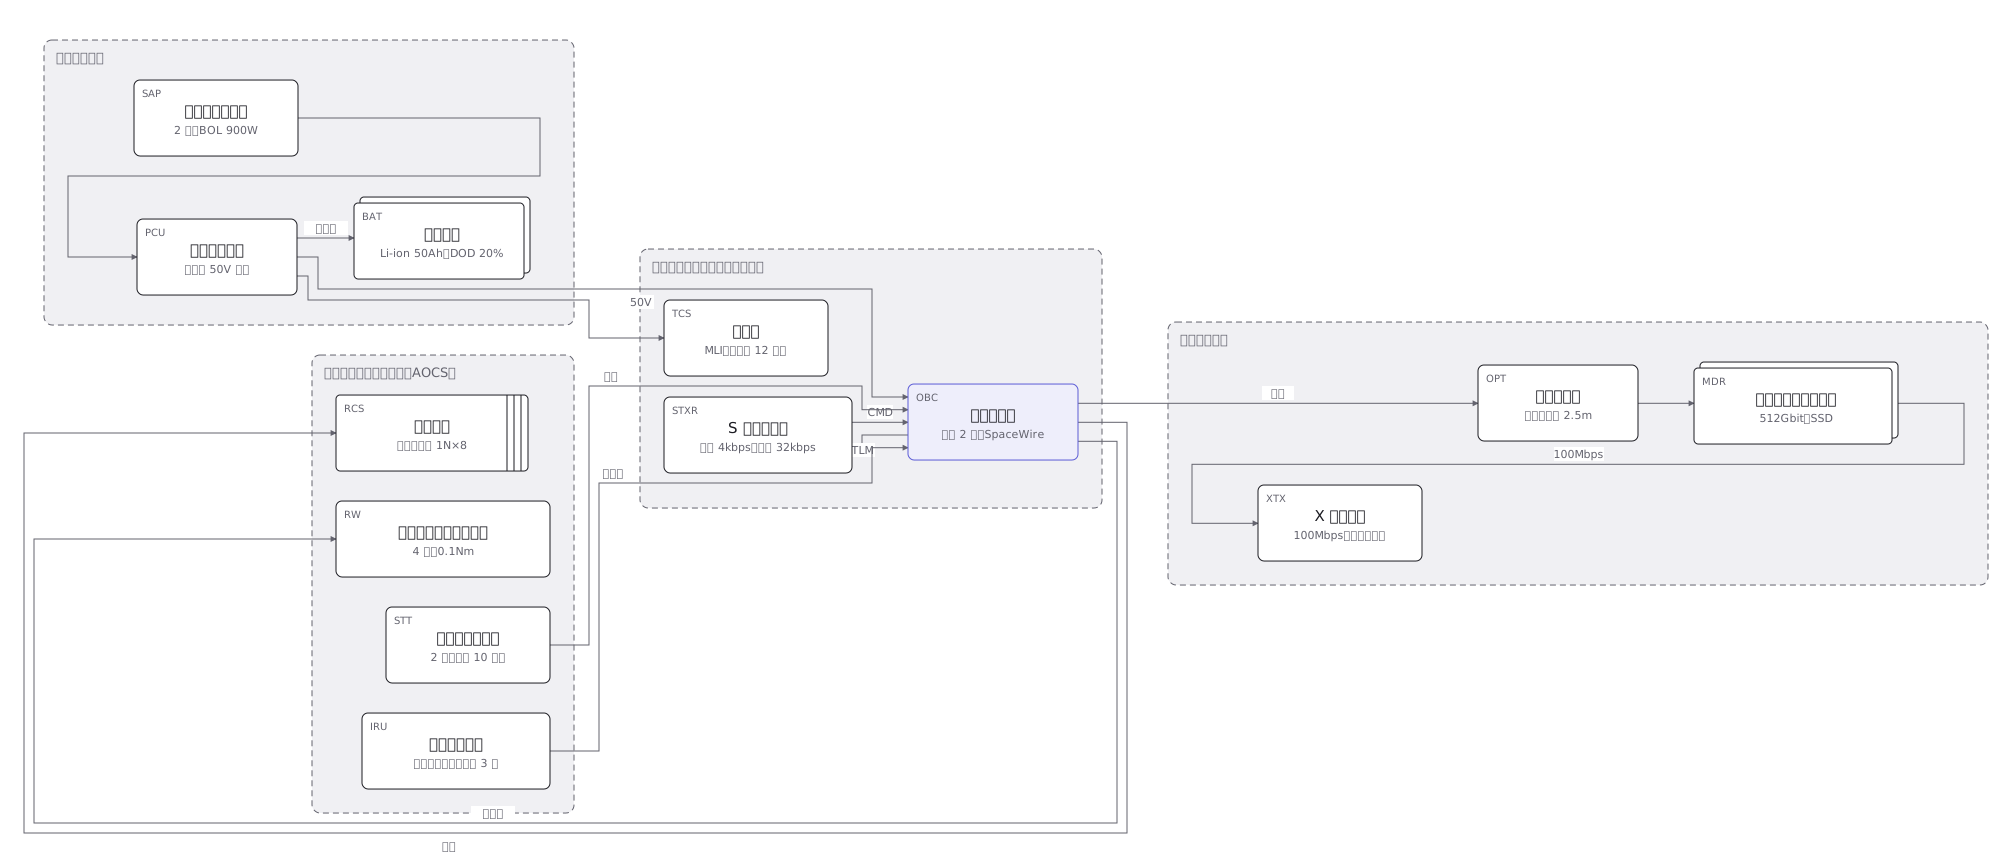 The subsystems of a 150kg satellite and how they connect: power, communications, attitude control, data handling and the mission payload
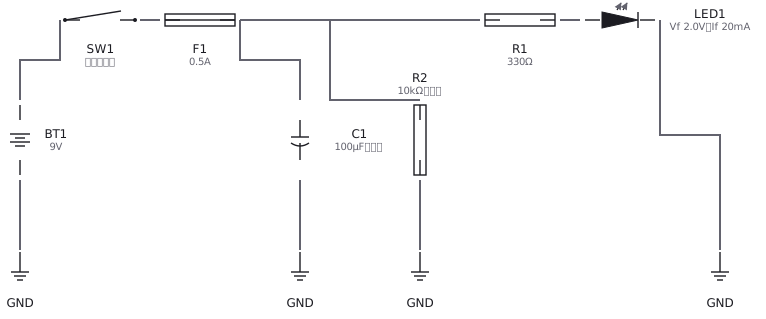 An LED circuit drawn with IEC and JIS symbols: supply, resistor, LED and switch