Transit and transport
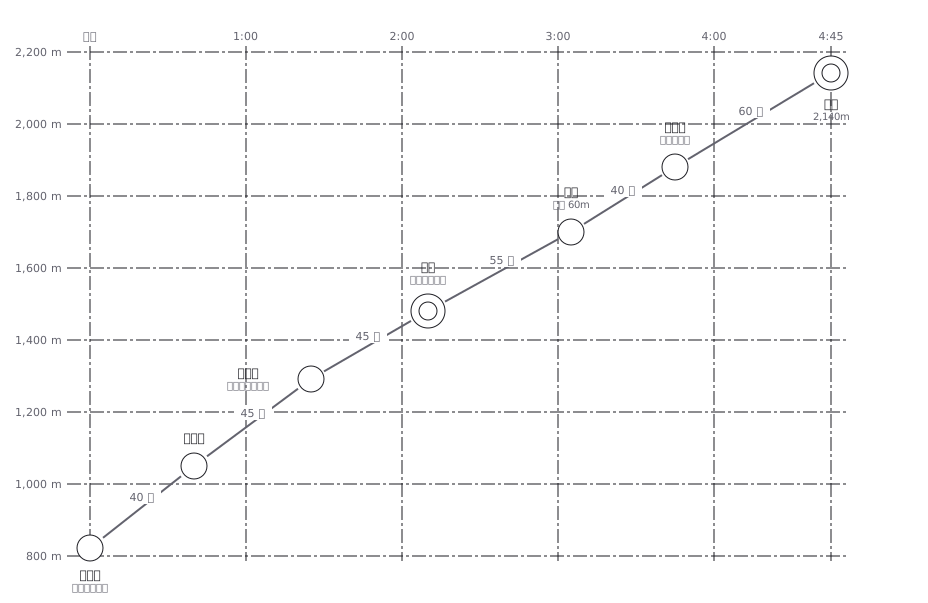
Hiking course-time chart for fictional Mt. Kakudake (north face route, 4 hours 45 minutes up)
A hiking profile with distance across and elevation up, annotated with how long each section takes to walk
This drawing comes from one YAML file. No shape was moved by hand.
Notes in the source (in Japanese)
山行計画の縦断図。横が累積コースタイム、縦が標高。線の傾きは 1 時間あたりに登る高さ(登高速度)。この図ではどの区間も毎時 240〜340m で、線はほぼまっすぐになる —— 登りのコースタイムは、距離より登る高さで大きく決まるから。きつい区間は、線が立つのではなく、横に長くなって現れる。目盛りだけなので寸法は引かない(mark: tick)。区間の数字はコースタイム。
横軸が距離ではなく「累積コースタイム」なのが、この図の肝。同じ 1km でも、平らな道と鎖場では倍以上ちがう ——距離で描くと、きつい所ほど短く見えるという逆の図になる。
休憩は足していない。 コースタイムは歩いている時間だけなので、実際の行動時間はこれより長くなる。下りは登りより短いので、往復の図は左右対称にならない。
Source (YAML)
examples/gallery/57-登山のコースタイム図.zumen.yaml
More in this field
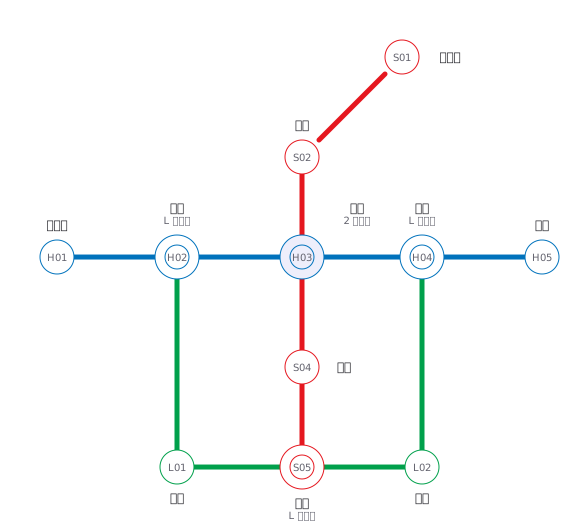 A fictional transit map of three lines told apart by colour and station numbering, drawn only in horizontal, vertical and 45° segments, with interchange stations marked by a double circle
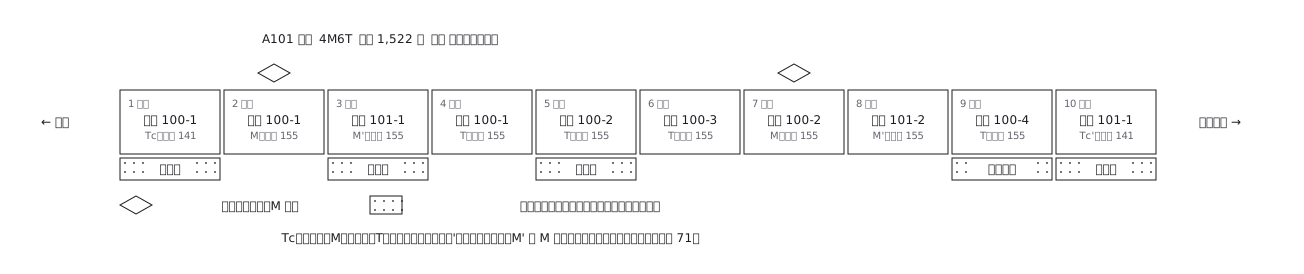 A ten-car commuter train set out car by car: which are motored and which are trailers, where the pantographs are, and what each car carries inside
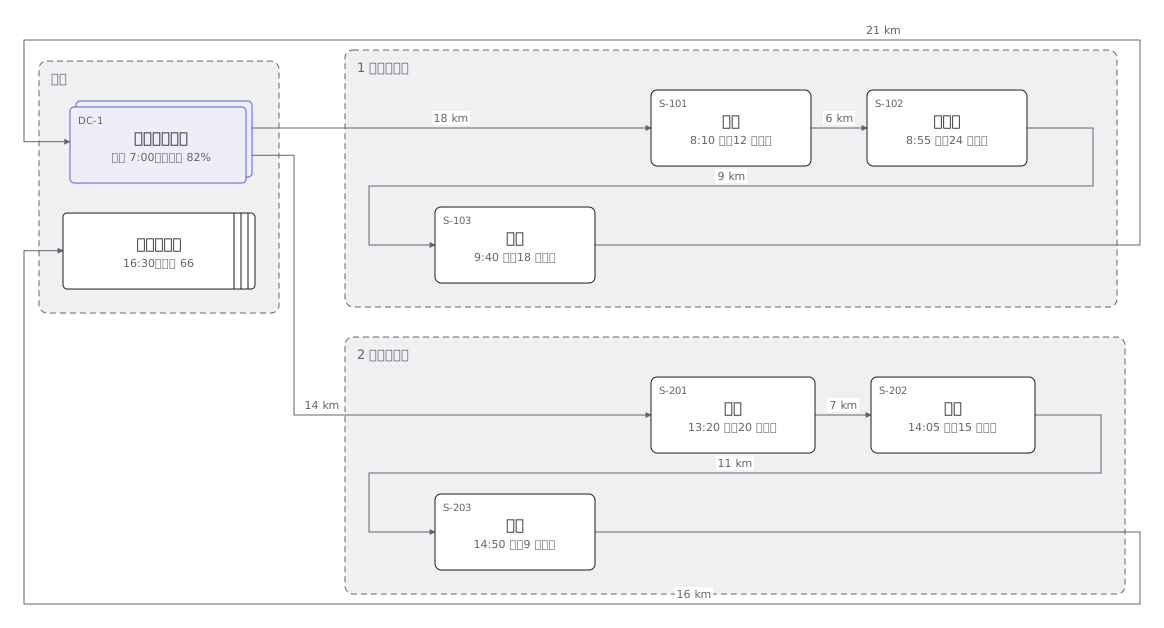 Delivery rounds for one two-tonne van split into a morning and an afternoon run: the order of calls and the stops themselves
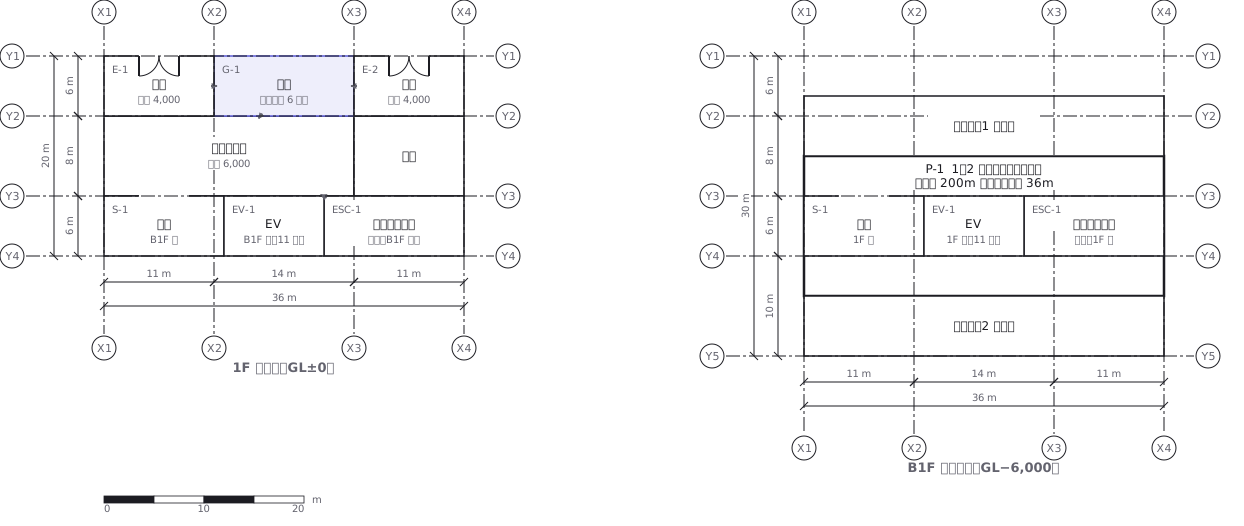 A station on two levels — ground floor and concourse — showing how the gates, stairs, lifts and exits line up with each other
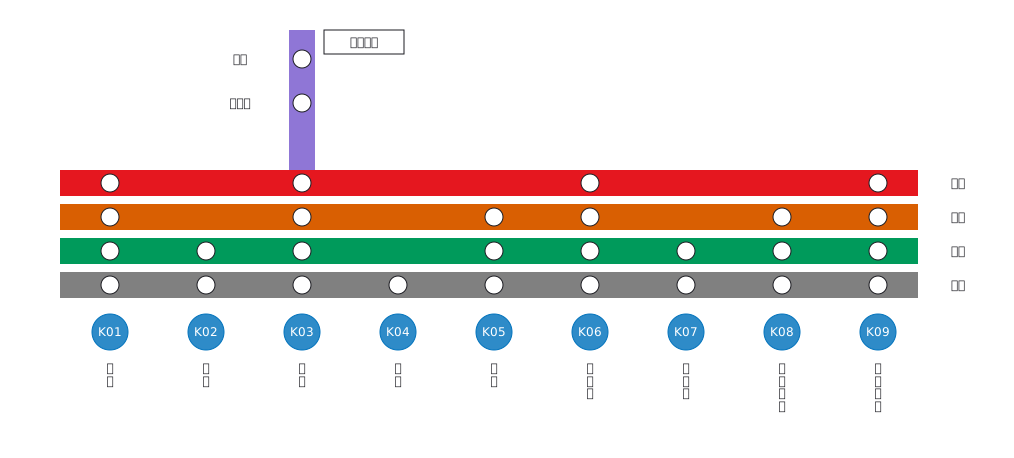 Stopping pattern chart: a band per service, a circle per stop
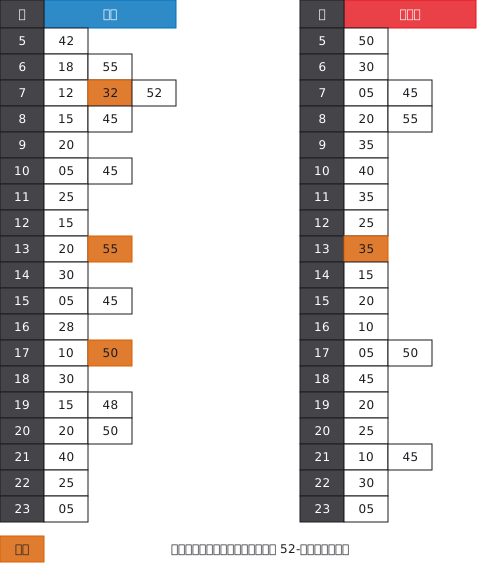 A station timetable with hours down the side and minutes across, weekday and weekend separated, and train types shown by symbol
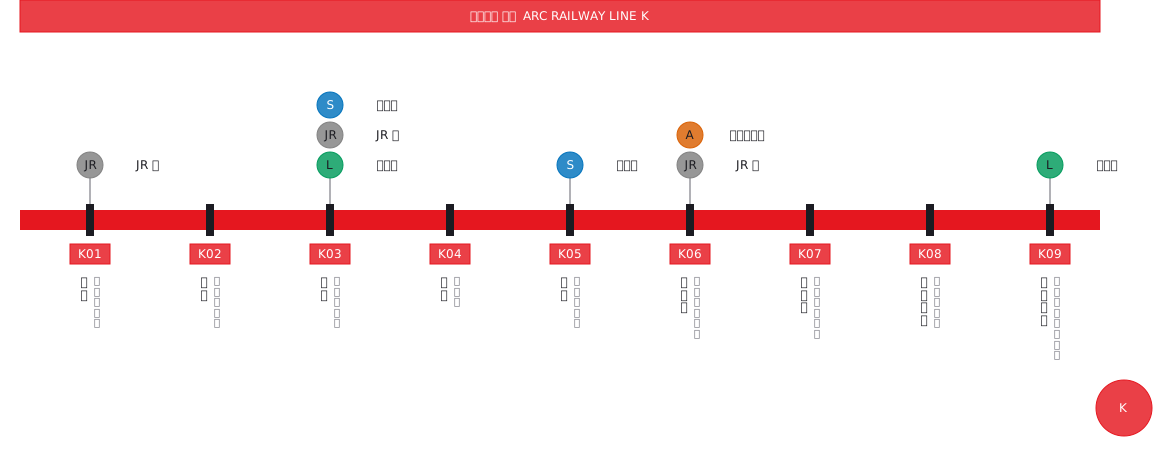 Interchange guide with station names set vertically
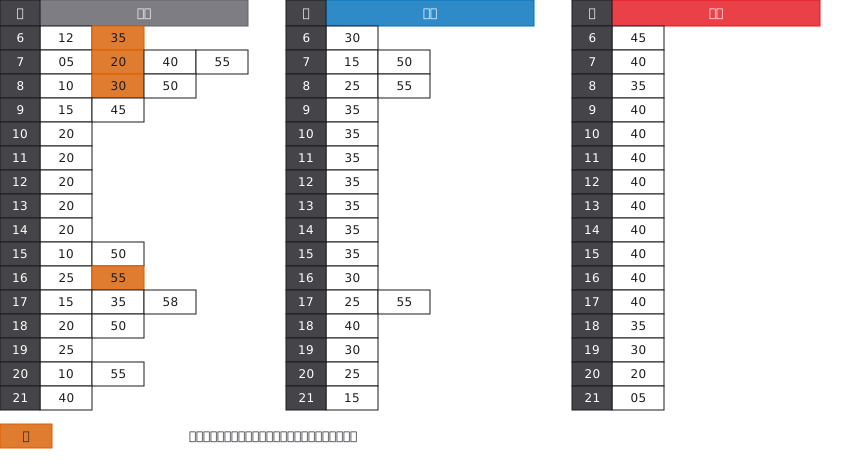 A bus stop timetable in three columns — weekday, Saturday, Sunday and holiday — with the departure minutes listed under each hour