Disaster and emergency
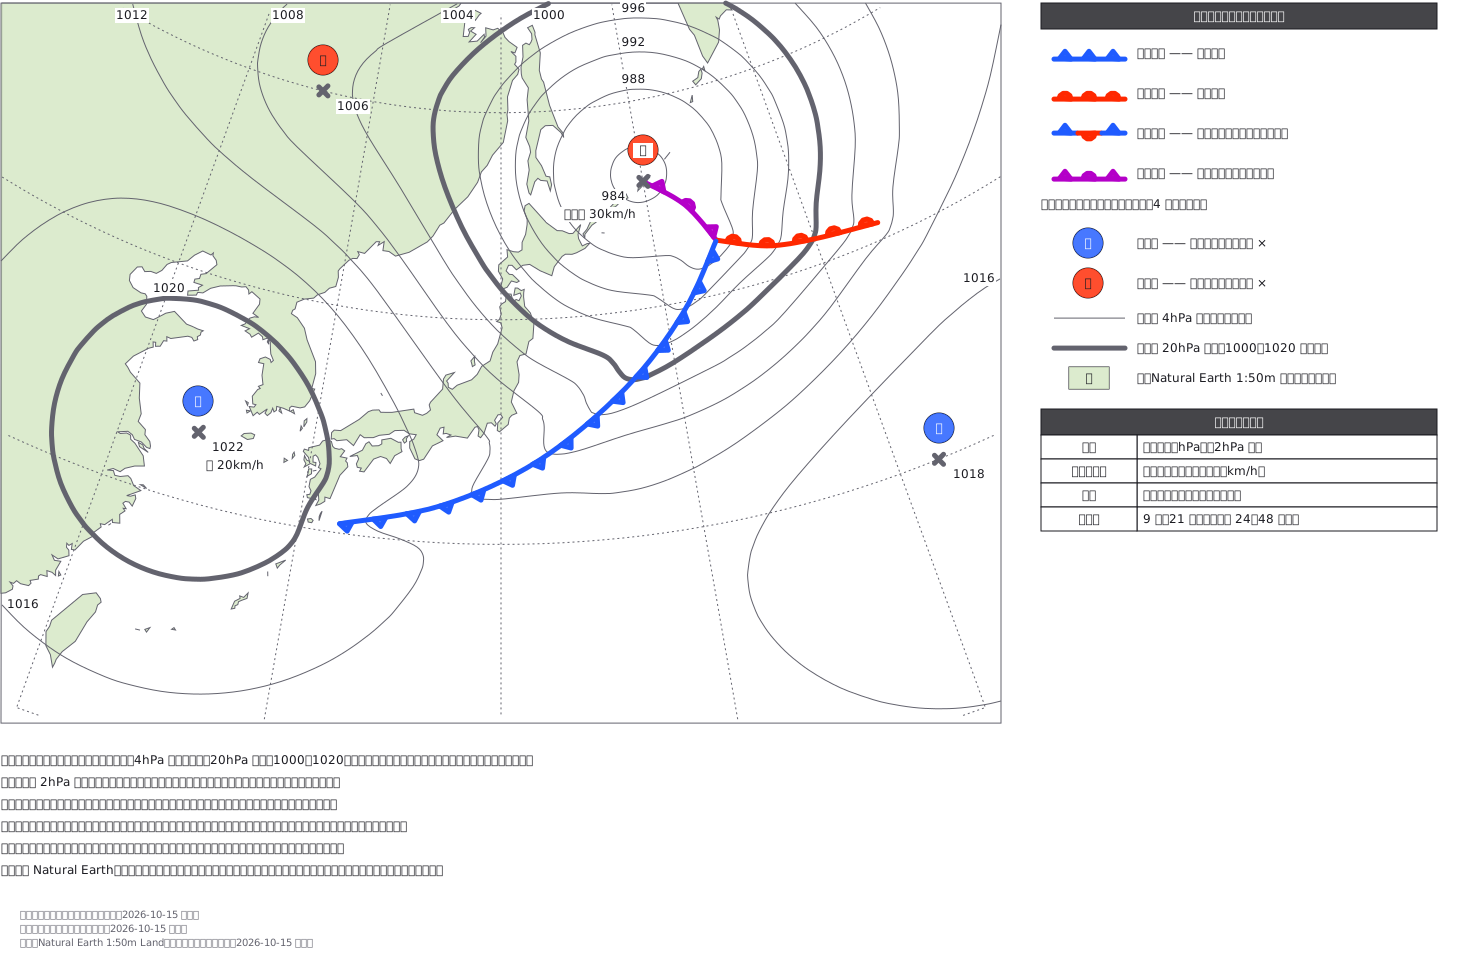
Surface weather chart (forecast chart around Japan with coastlines; fictional pressure pattern)
Surface weather chart around Japan (a fictional forecast): coastlines on a polar stereographic base, isobars every 4 hPa traced from a pressure field with 1000 and 1020 hPa drawn thick, a deepening low east of Hokkaido with occluded, warm and cold fronts whose symbols sit on the side the front is moving toward, and the JMA blue H / red L stamps.
This drawing comes from one YAML file. No shape was moved by hand.
Notes in the source (in Japanese)
地上天気図は、気圧の地形図。 等圧線は気圧が同じところを結んだ線で、混んでいるところほど風が強い。
決まり(気象庁「実況天気図の解説」)——- 等圧線は 4hPa ごとの細い実線、20hPa ごと(1000・1020)は太い実線- 高気圧は中心に × と青の「高」、低気圧は × と赤の「低」。数字は中心気圧(hPa)- 前線は 4 種。寒冷=青の三角、温暖=赤の半円、停滞=青の三角と赤の半円が反対側、閉塞=紫の三角と半円が同じ側- 「前線上のマークのない側からマークのある側へ移動」。寒冷前線は寒気側→暖気側、温暖前線は暖気側→寒気側
等圧線は手で引かず、気圧の場(高・低の山と谷の和)から 4hPa ごとに等値線を取った。前線に沿って気圧の谷を入れてあるので、等圧線は前線のところで V 字に折れる —— 実物の天気図と同じ。前線の記号は線に沿って 34px おきに置き、進む向きの側へ向けた(寒冷は南東、温暖は北、閉塞は東)。
地図は北極を中心とする平射図法(気象庁の天気図と同じ系統。緯線が弧になる)、中心経線 140°E。陸は Natural Earth 1:50m(パブリックドメイン)を 0.9px で間引いた。国境は描いていない(陸と海だけ)。
前線の青は #1f5bff。気象庁の配色指針の青(#0041ff)は暗い地で 3:1 を割るので、白地・暗い地の両方で 3:1 を超える青に寄せた。気圧配置は架空(秋に多い形)。テレビ局の様式は写していない。記号だけを大きく並べた読み方の図は見本 185。
Source (YAML)
examples/gallery/391-地上天気図-日本付近の予想図.zumen.yaml
More in this field
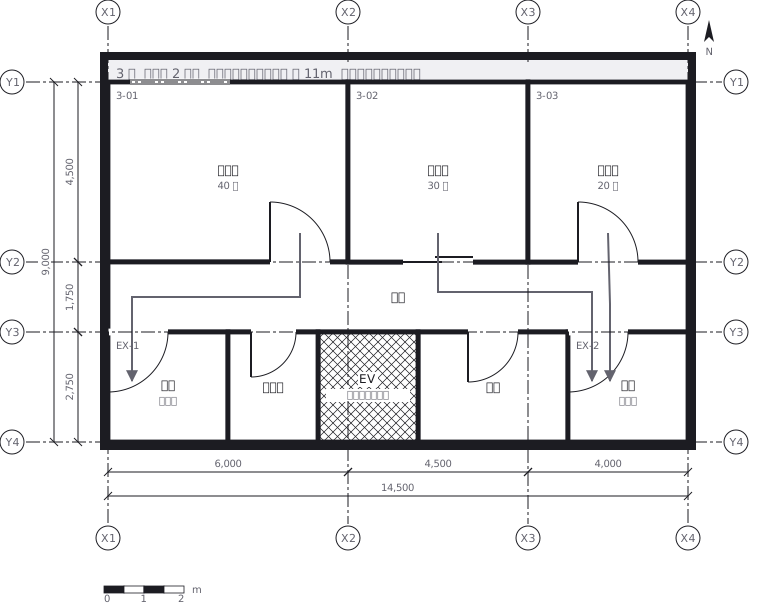 Escape routes on a third floor: two ways out of every room to a staircase, with the travel distance and the fire doors and extinguishers along the way
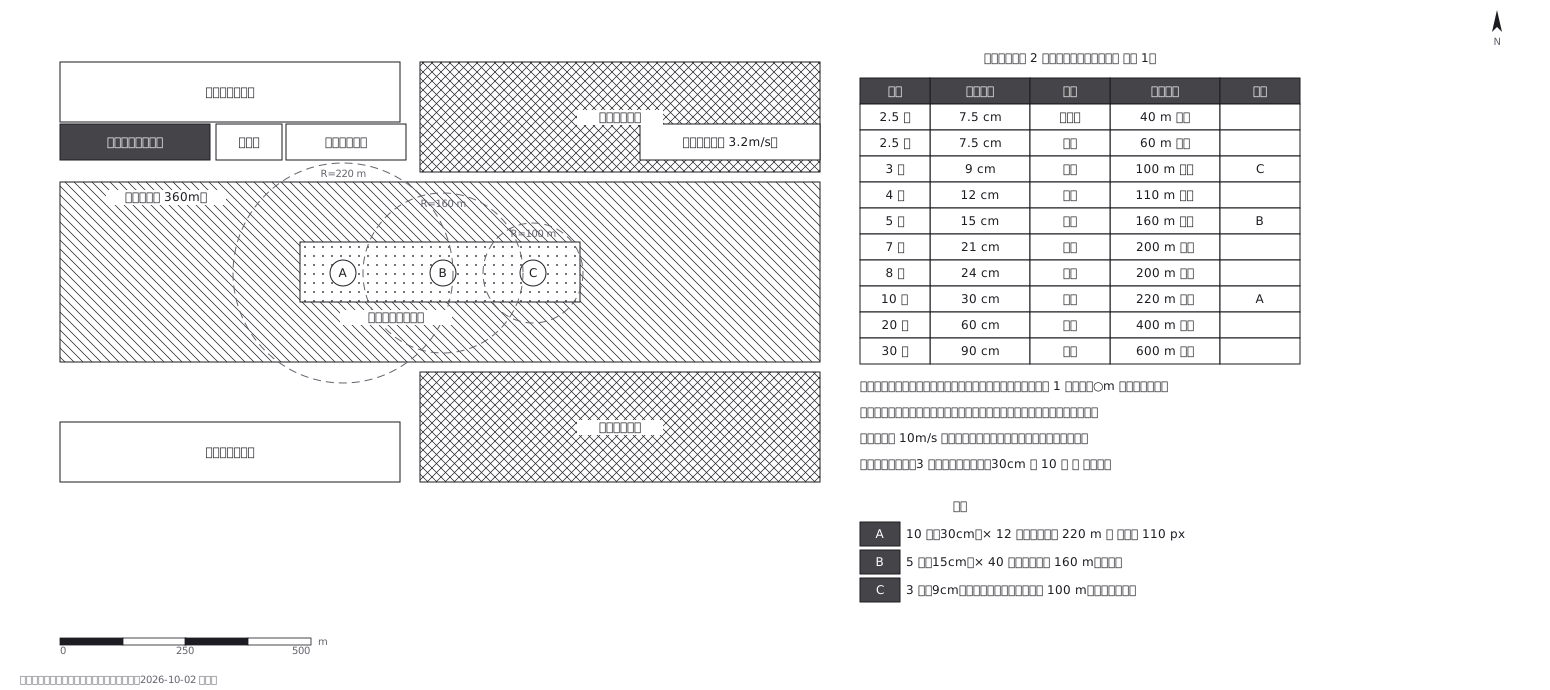 Fireworks safety distances, a circle per shell size
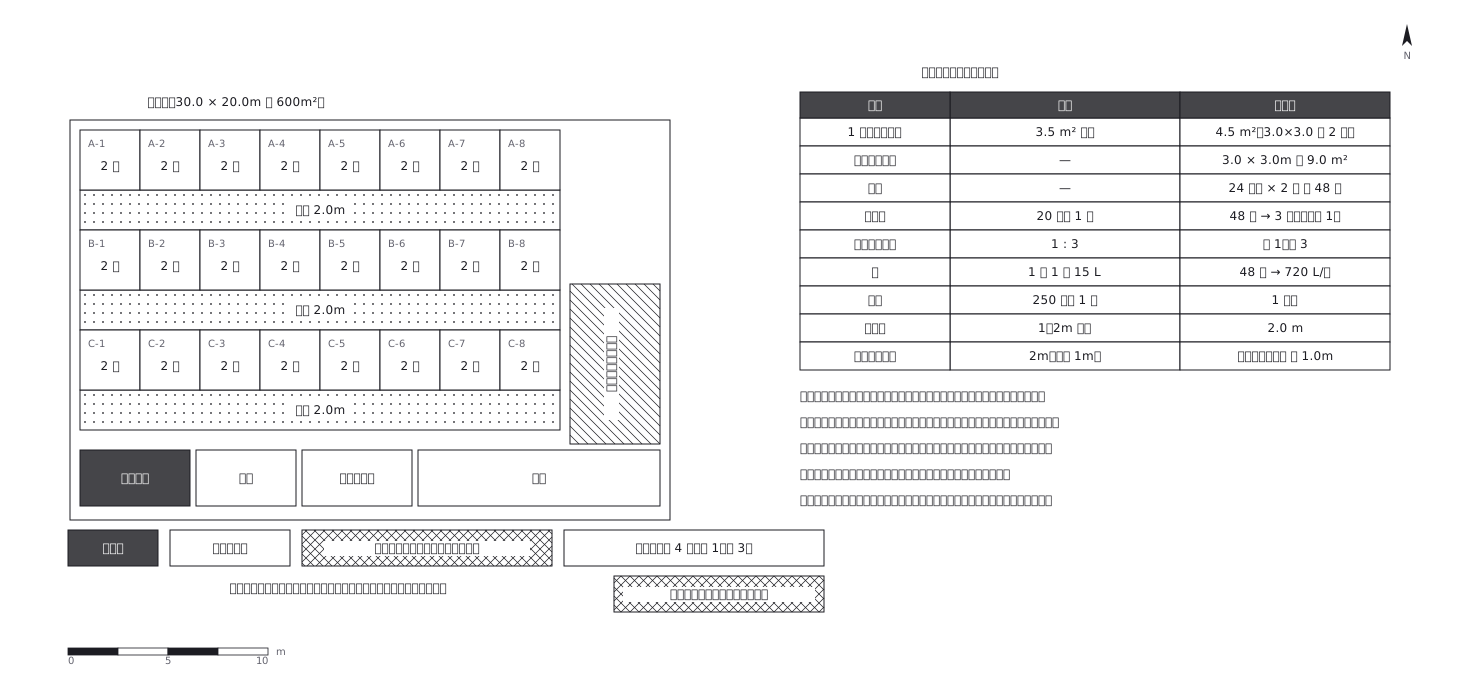 Shelter layout: 3.5 sq m a person, and how many toilets
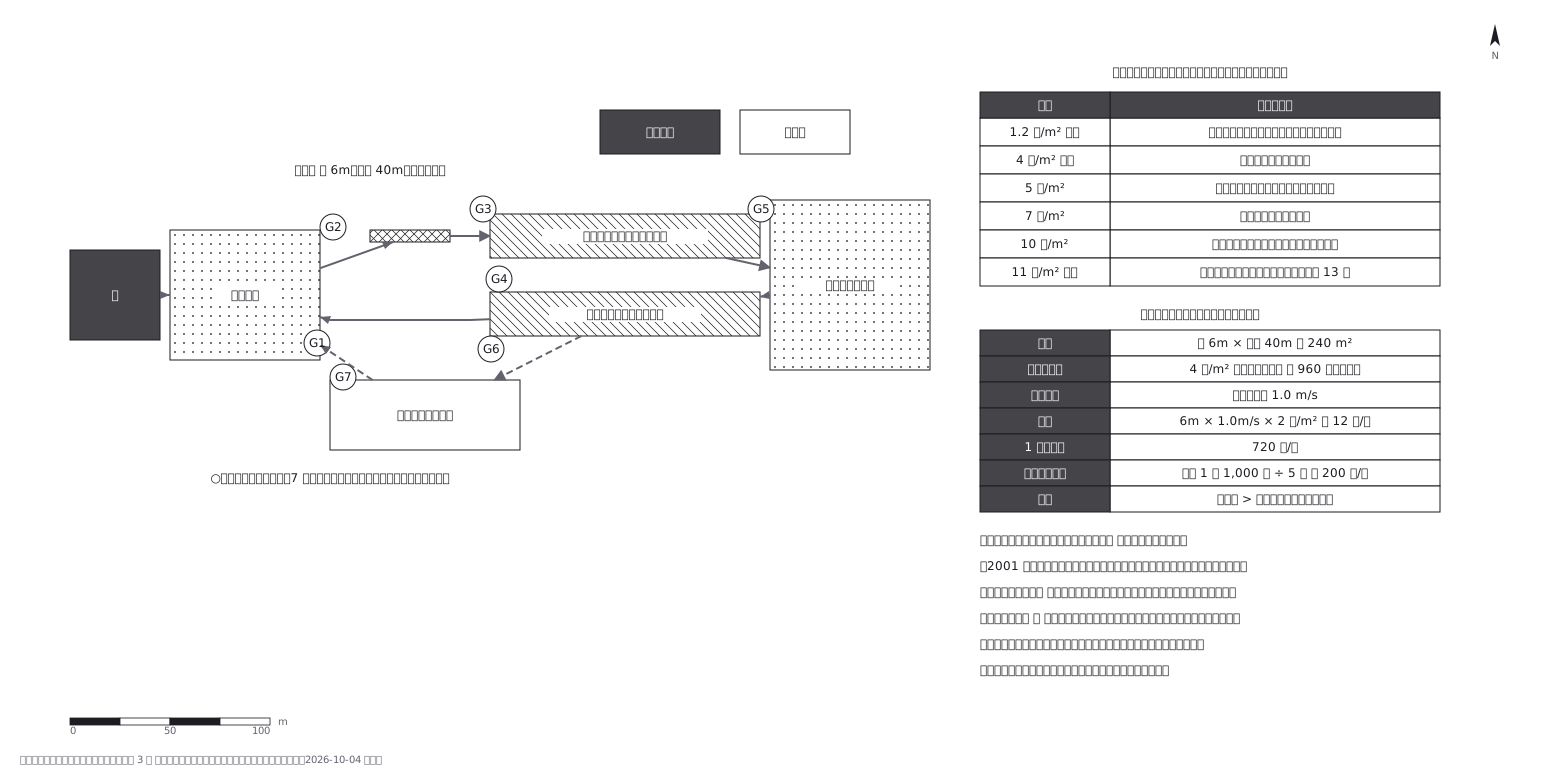 Crowd plan: how many can flow out against how many come in
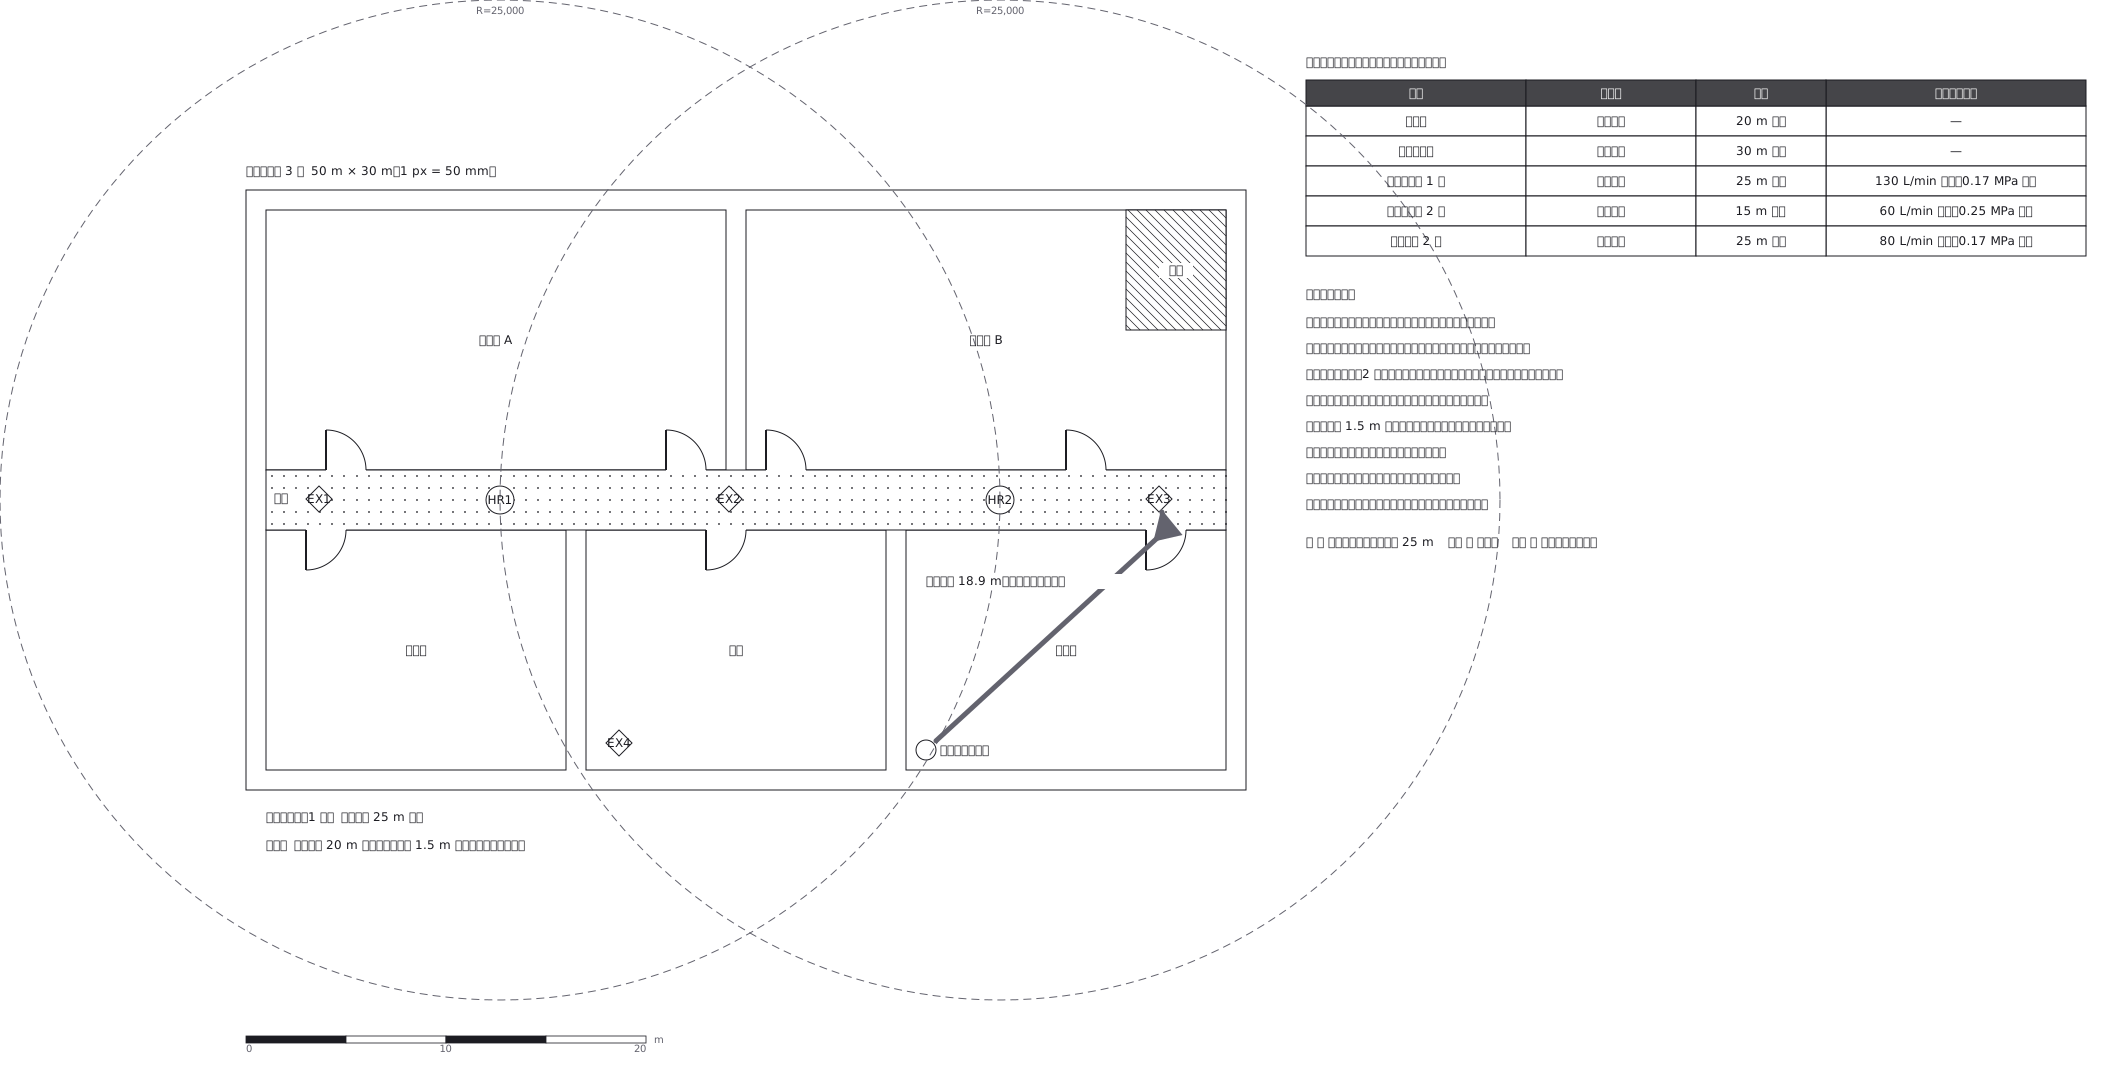 Extinguishers and hose reels, measured two different ways
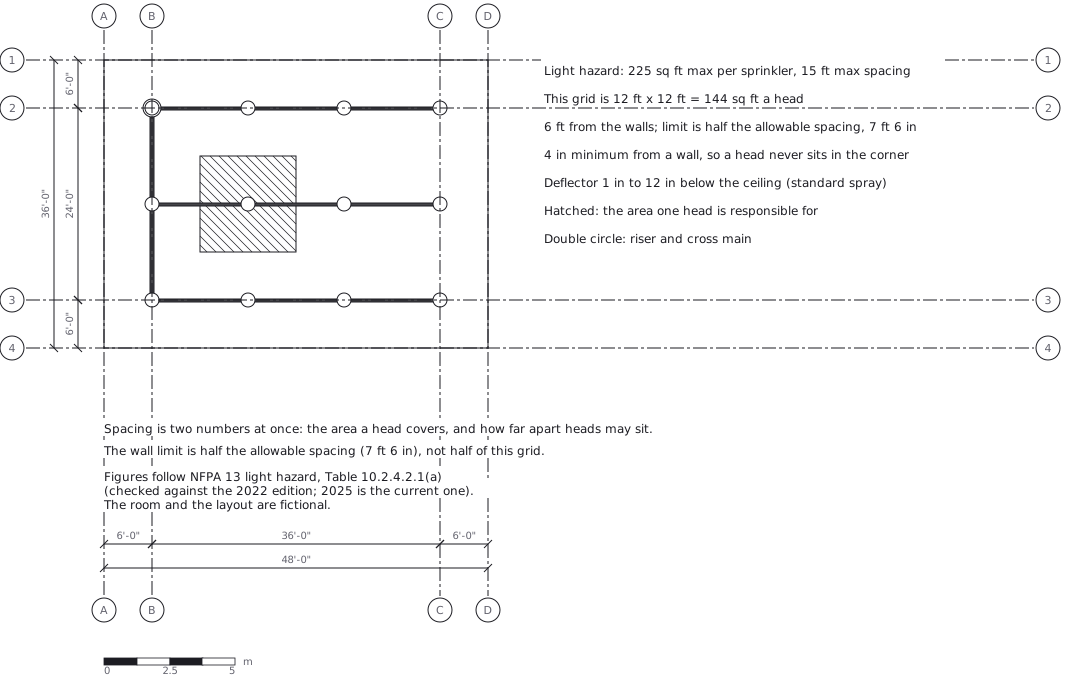 Sprinkler layout: area per head and spacing, decided together
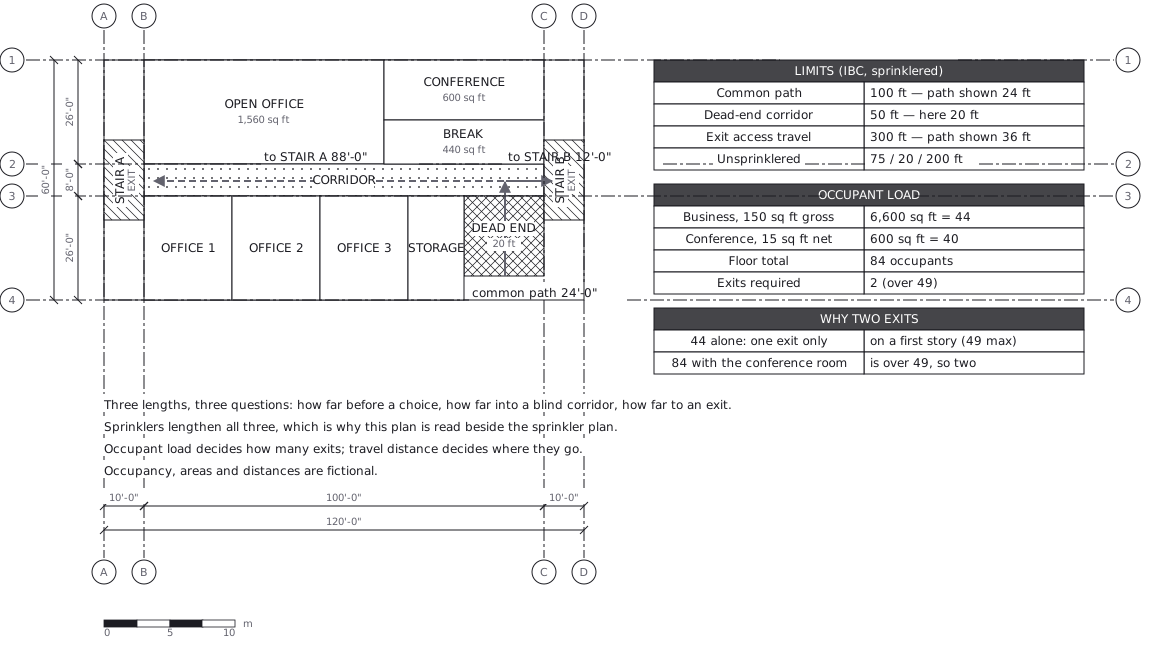 Egress plan: three lengths answering three questions
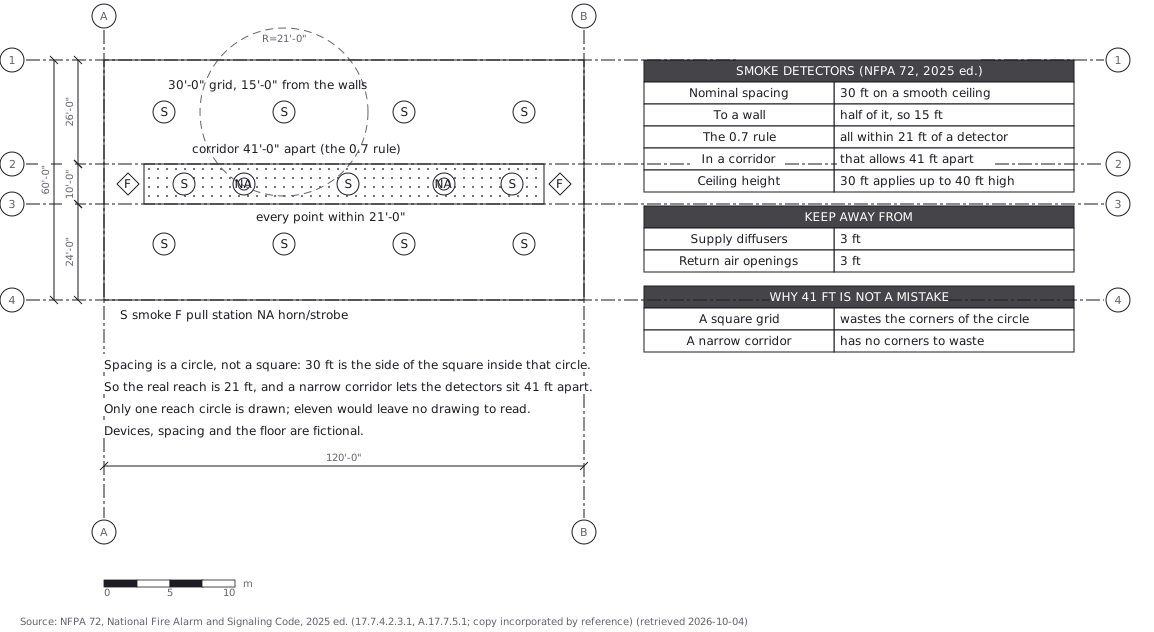 Fire alarm devices: spacing is a circle, not a square