Disaster and emergency
40 drawings in Disaster and emergency, each generated from a single YAML file.
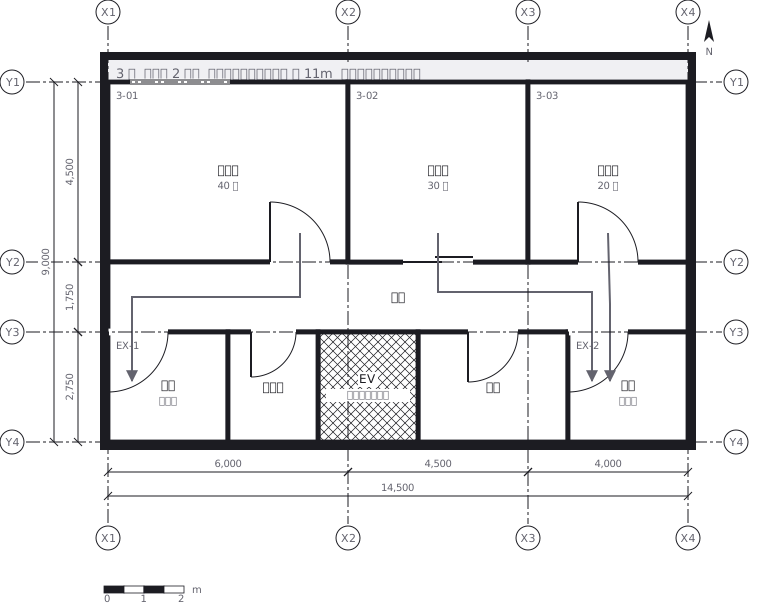 Escape routes on a third floor: two ways out of every room to a staircase, with the travel distance and the fire doors and extinguishers along the way
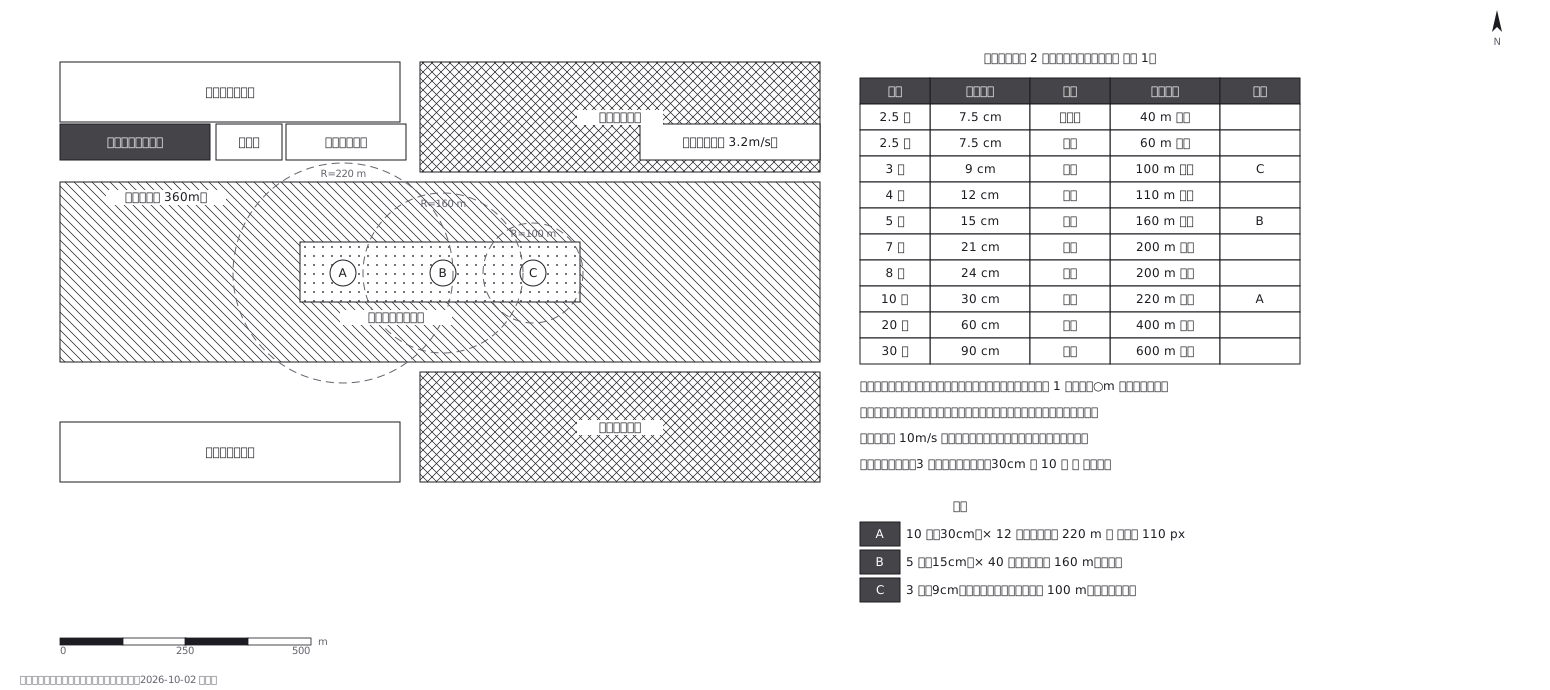 Fireworks safety distances, a circle per shell size
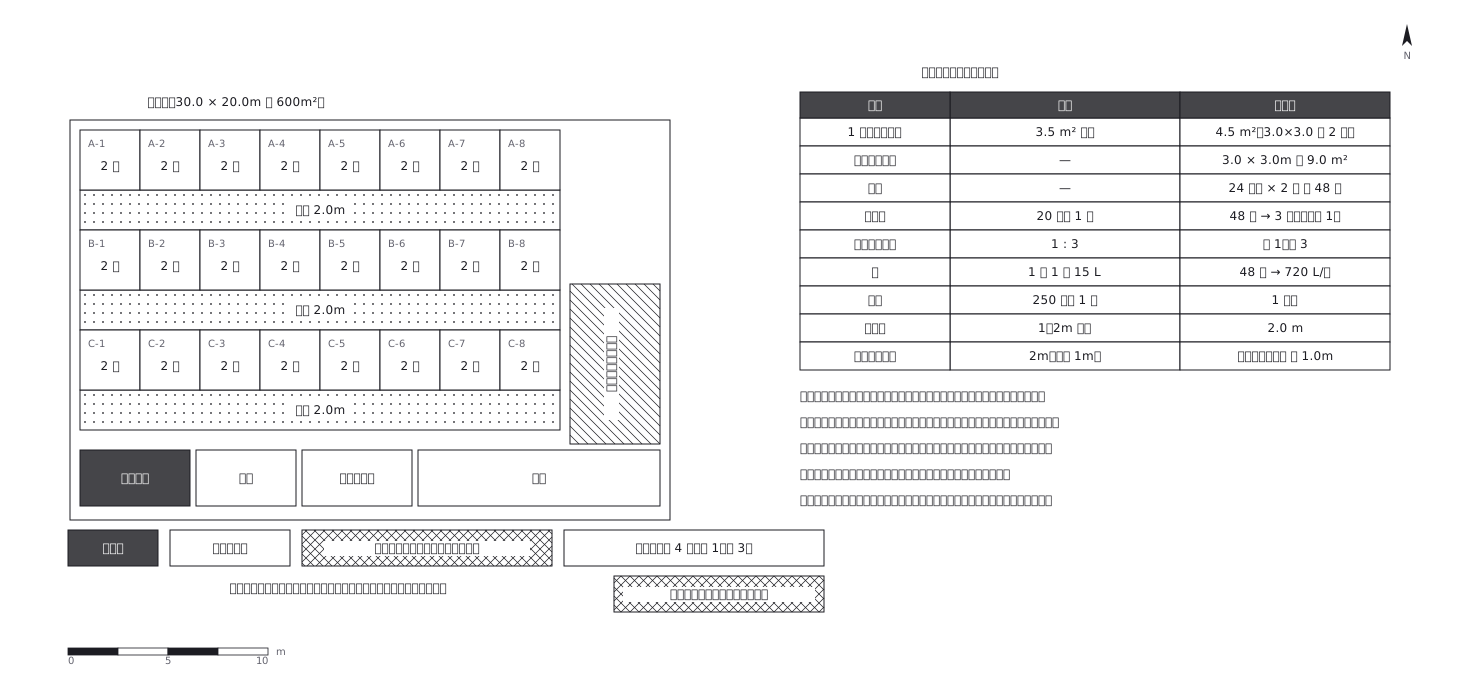 Shelter layout: 3.5 sq m a person, and how many toilets
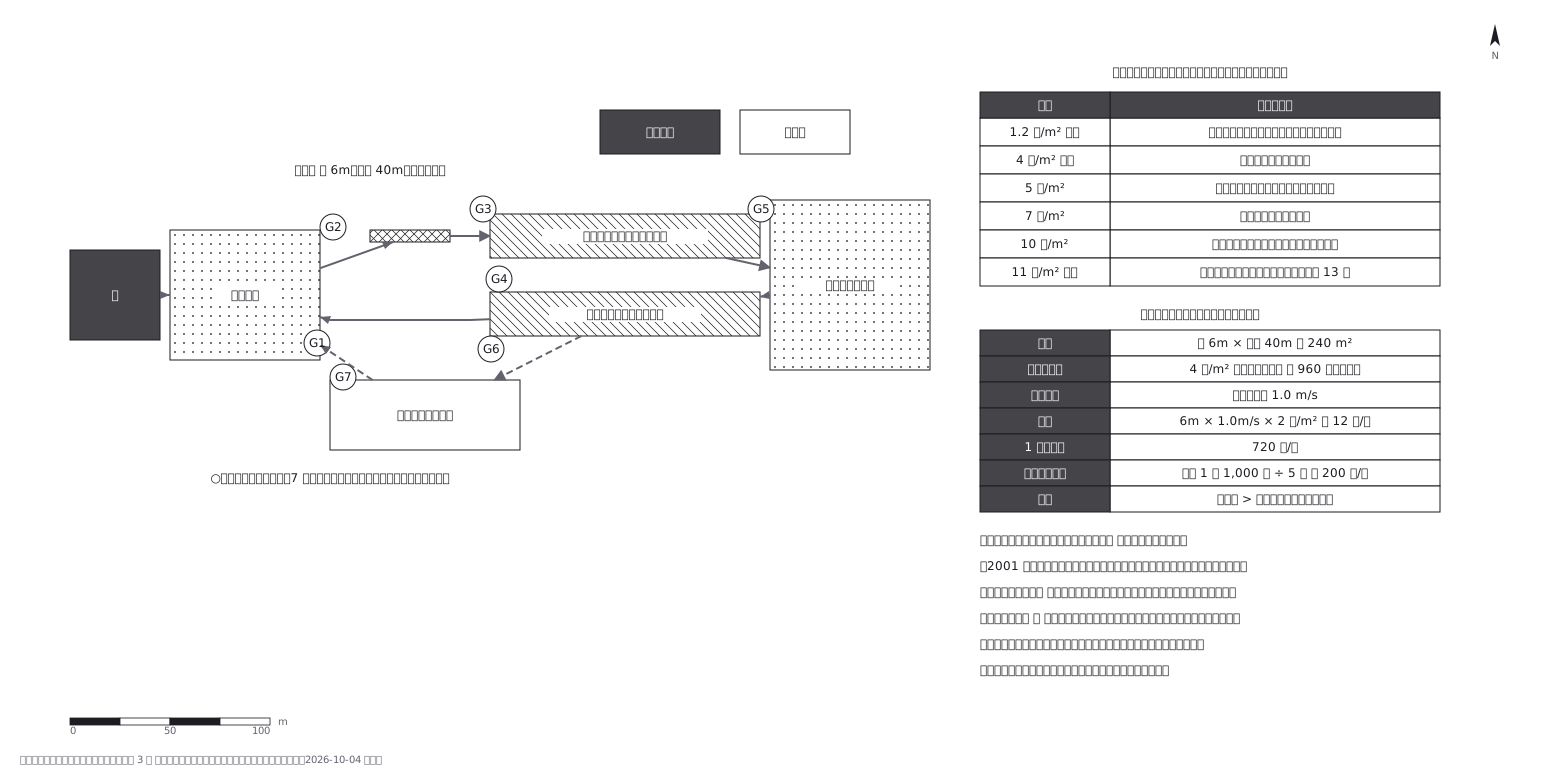 Crowd plan: how many can flow out against how many come in
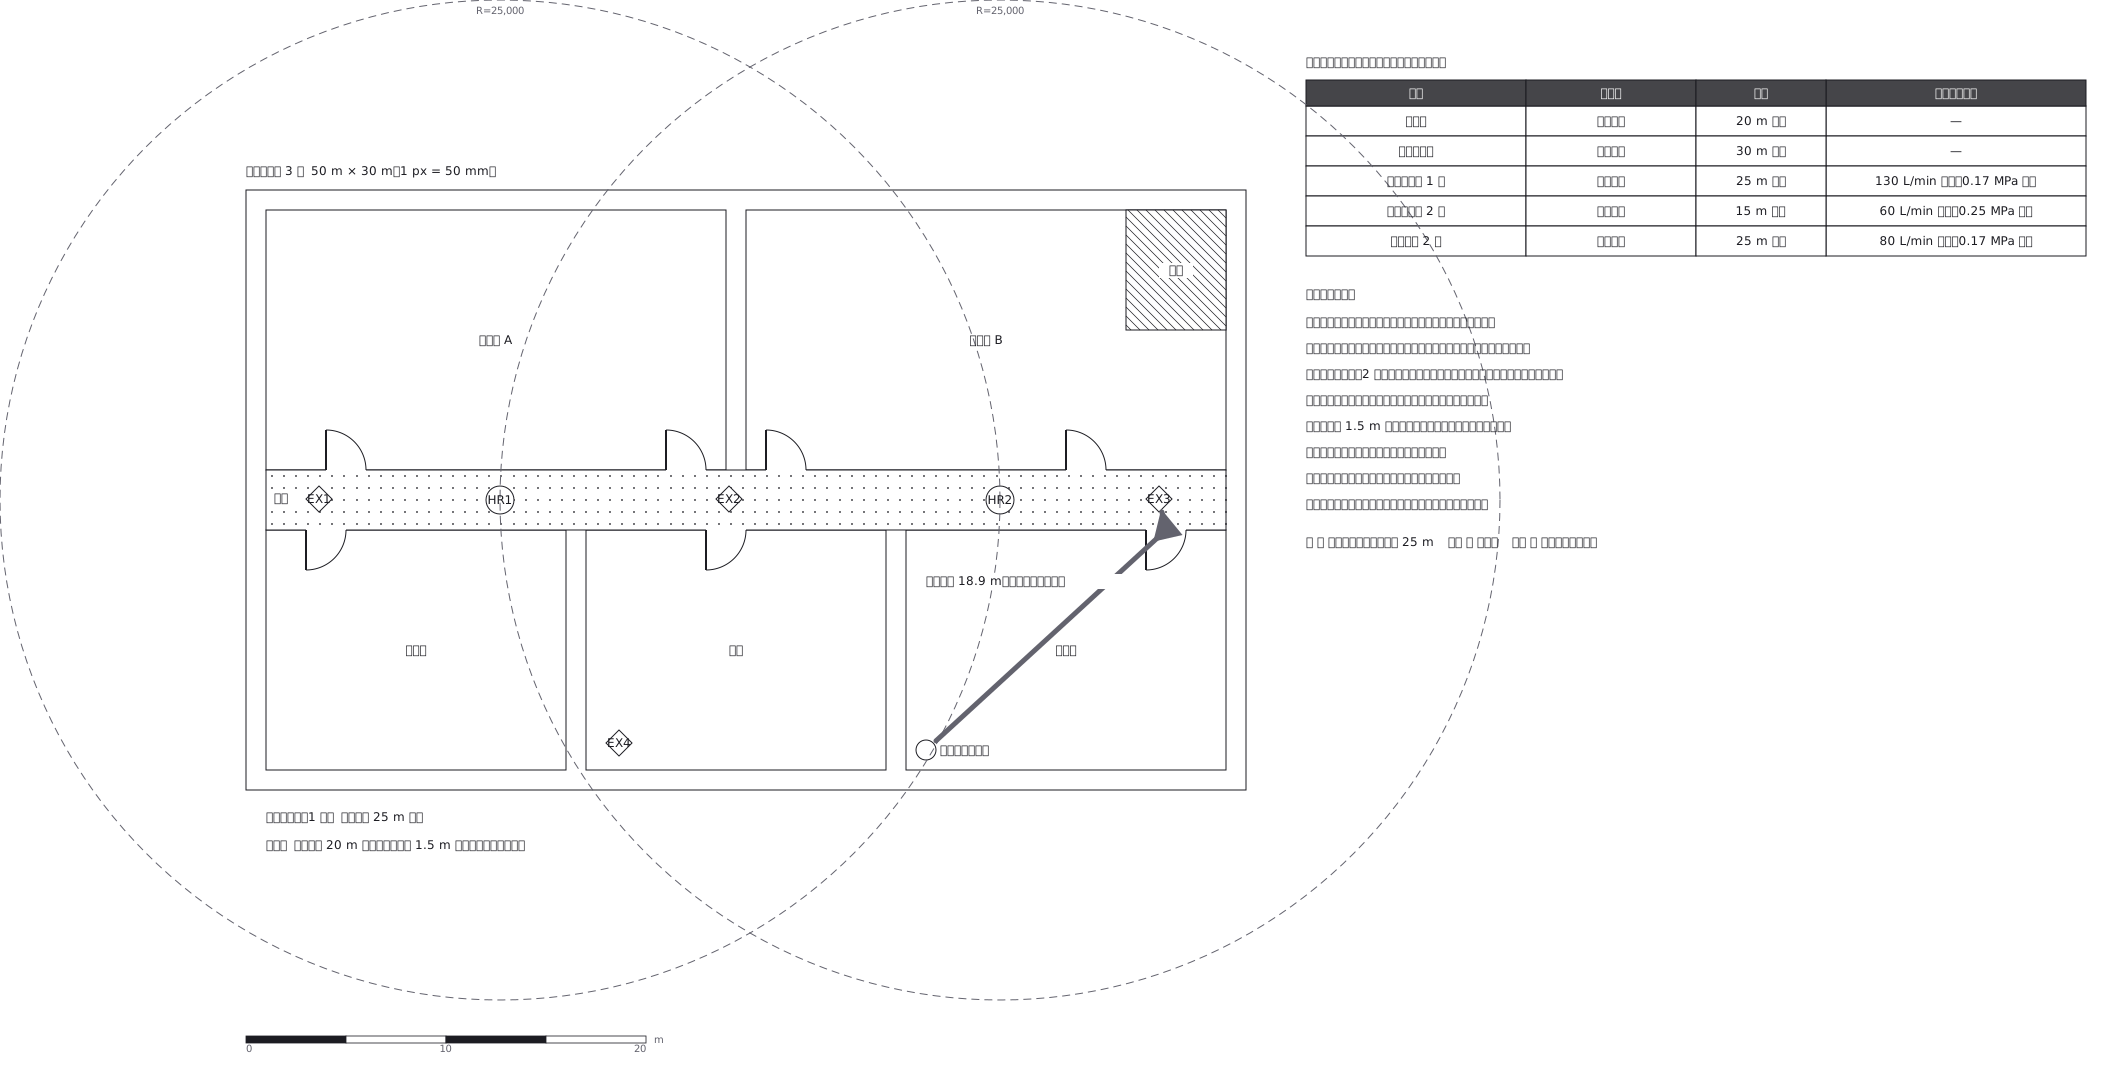 Extinguishers and hose reels, measured two different ways
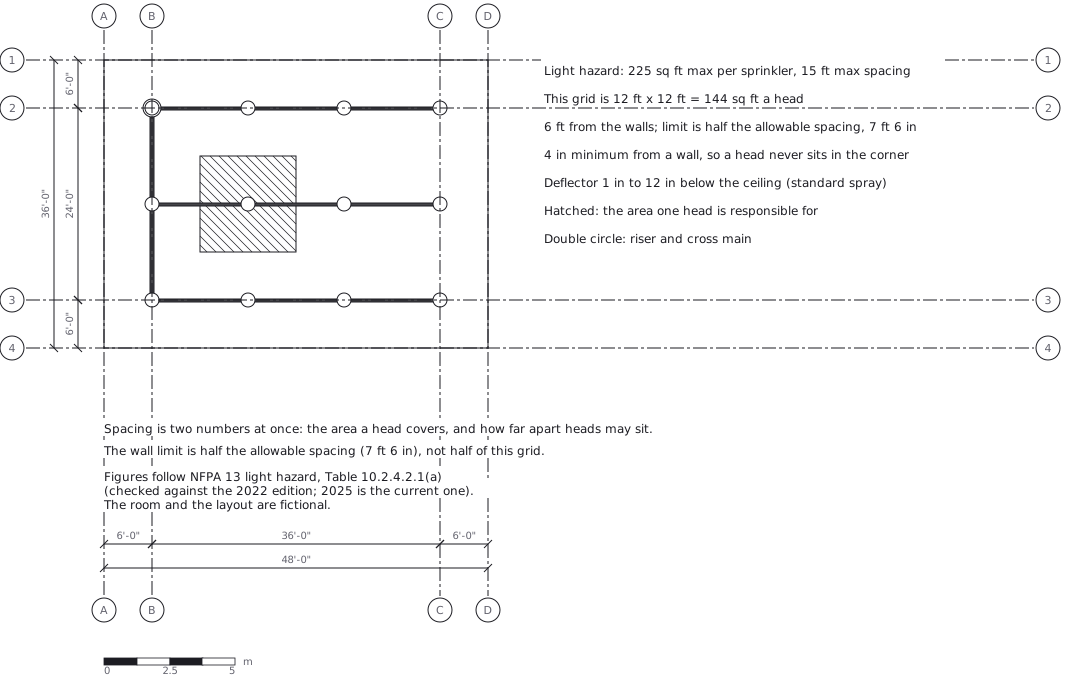 Sprinkler layout: area per head and spacing, decided together
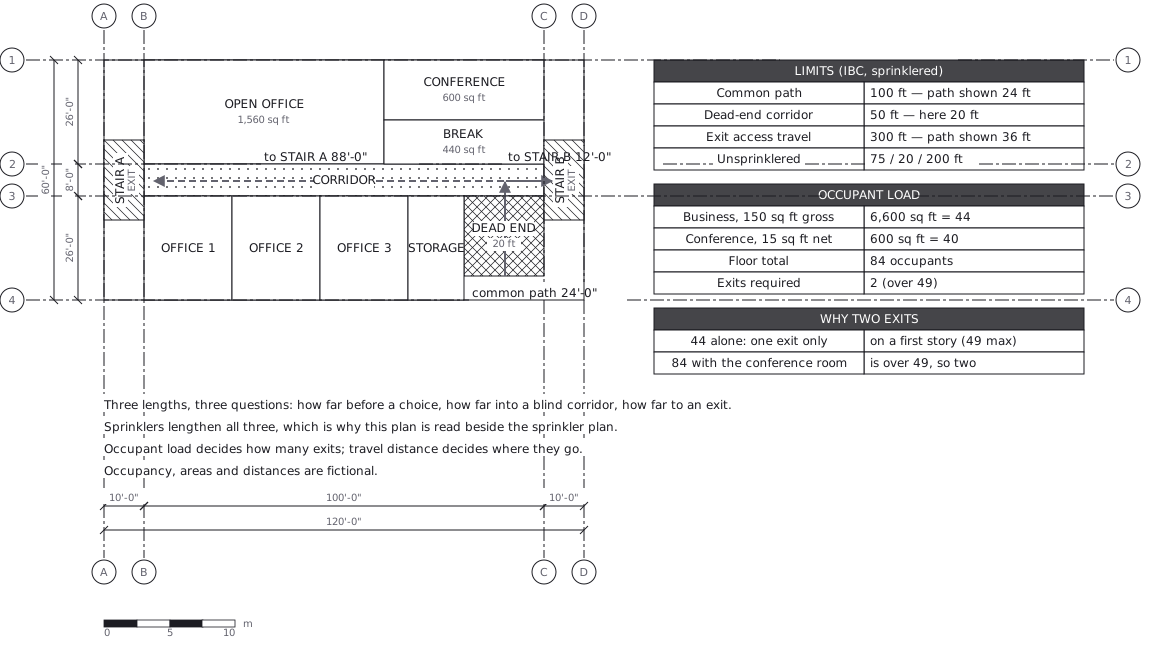 Egress plan: three lengths answering three questions
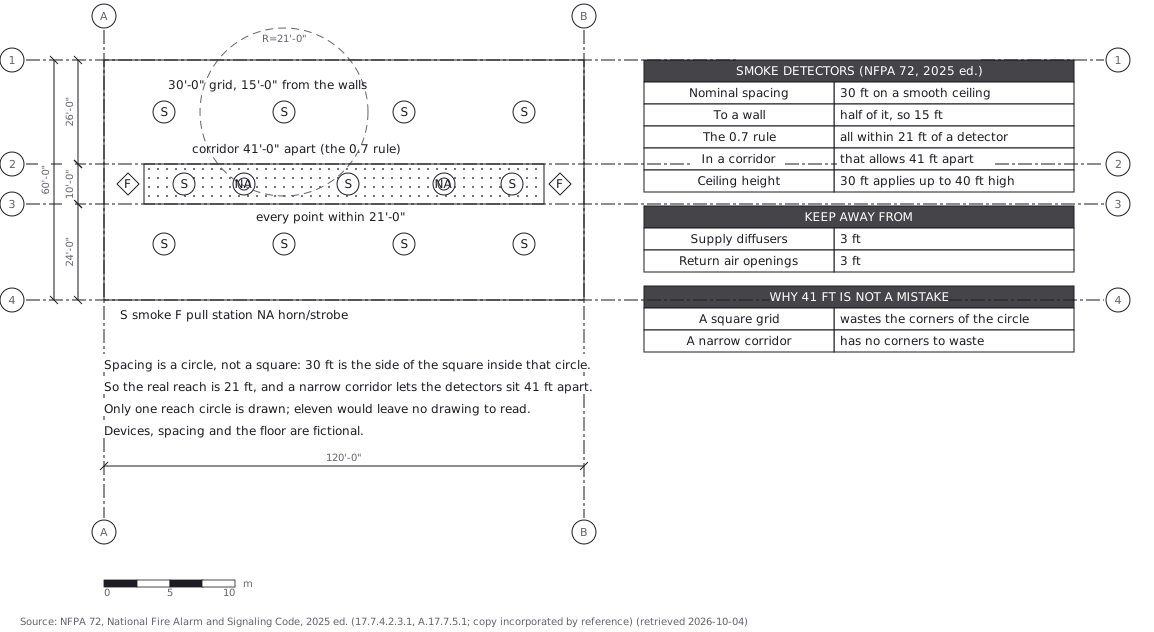 Fire alarm devices: spacing is a circle, not a square
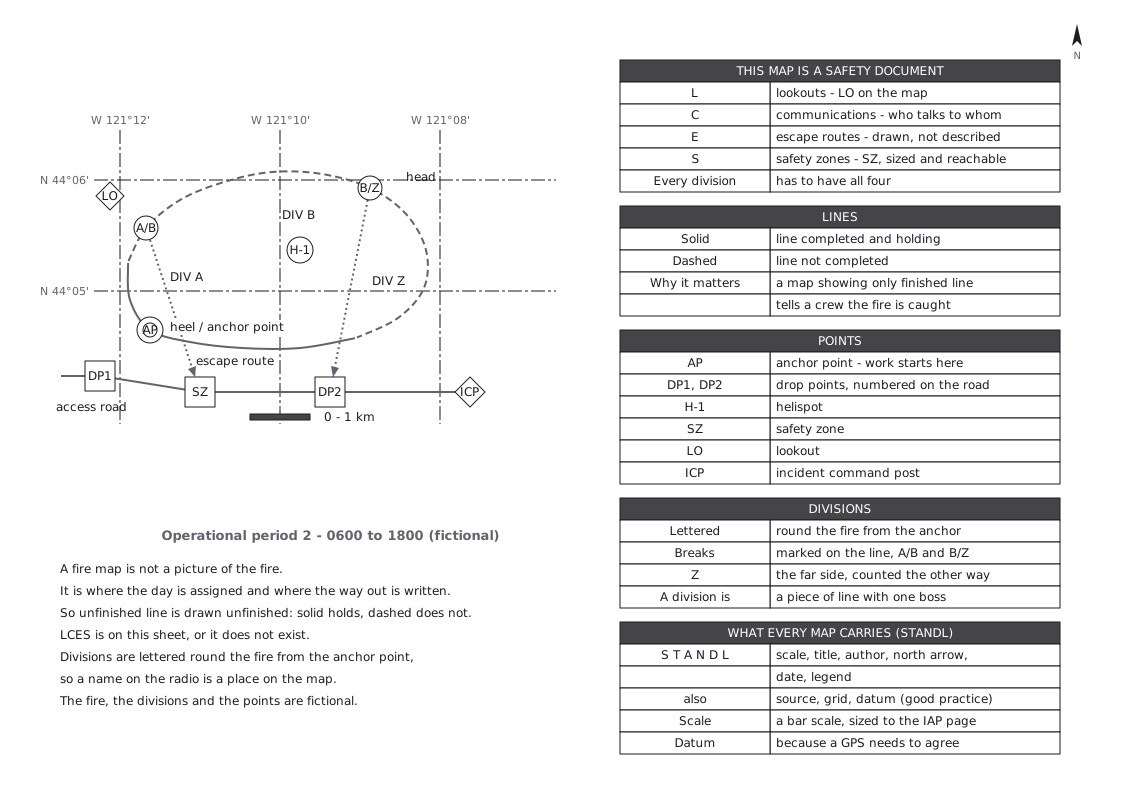 Not a picture of the fire - the way out is written on it
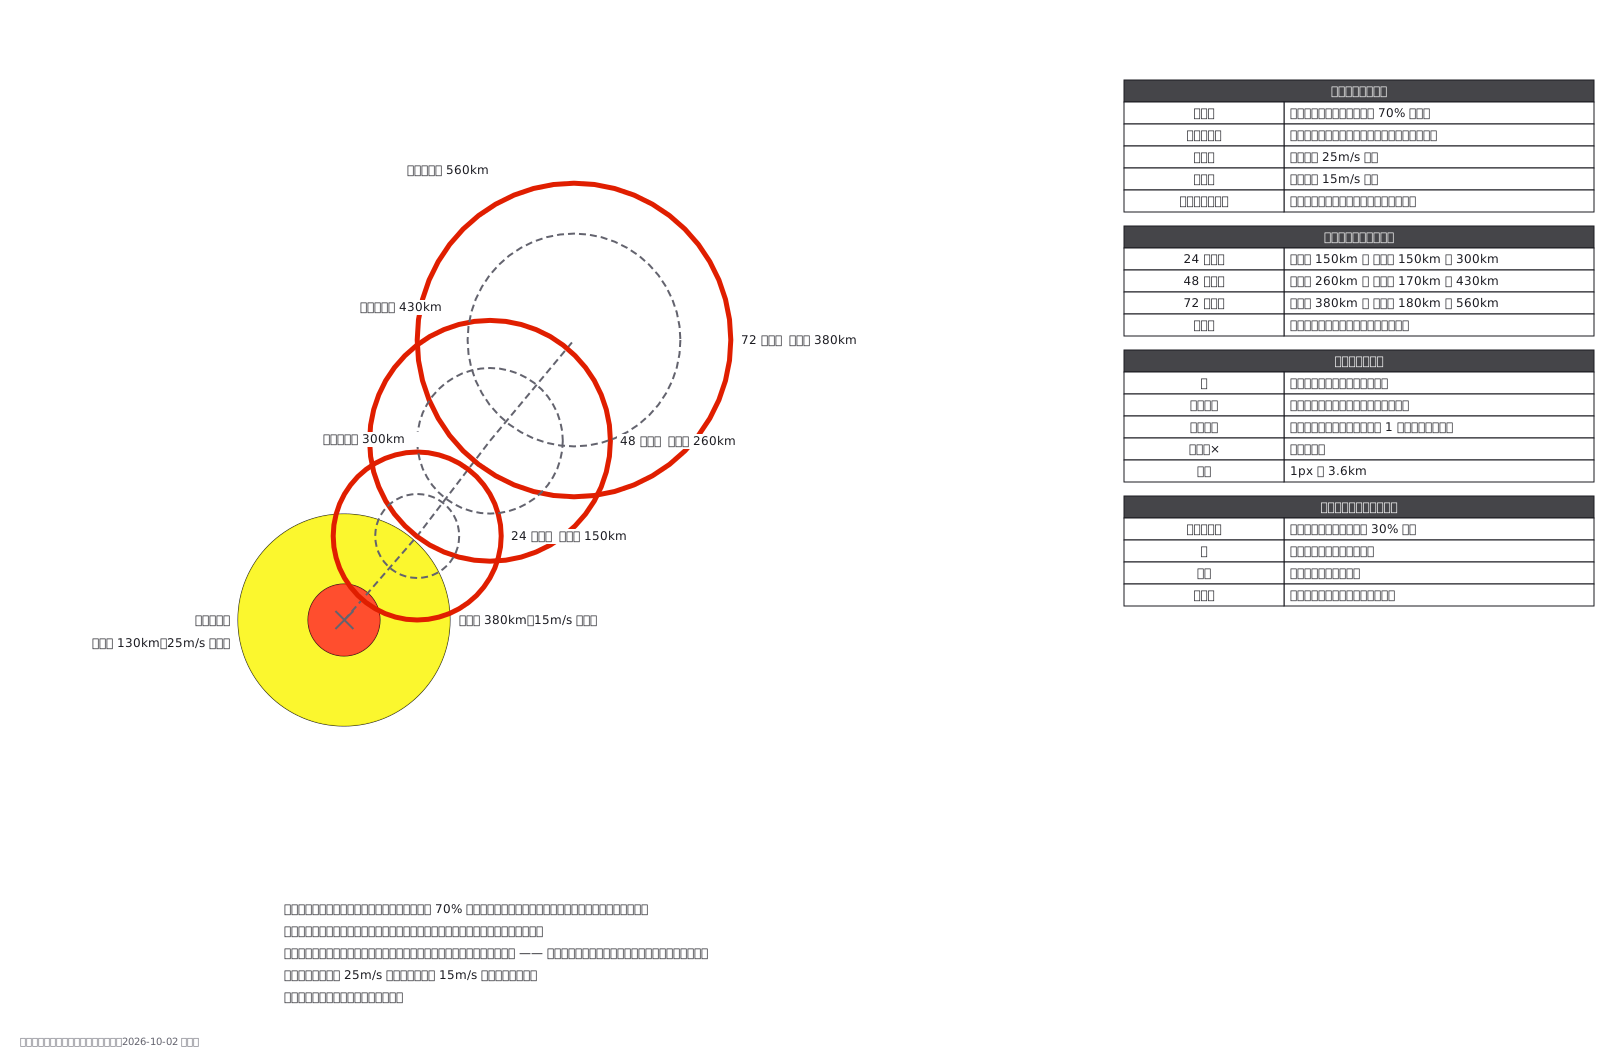 A typhoon forecast: the circle is where the centre lands 70% of the time
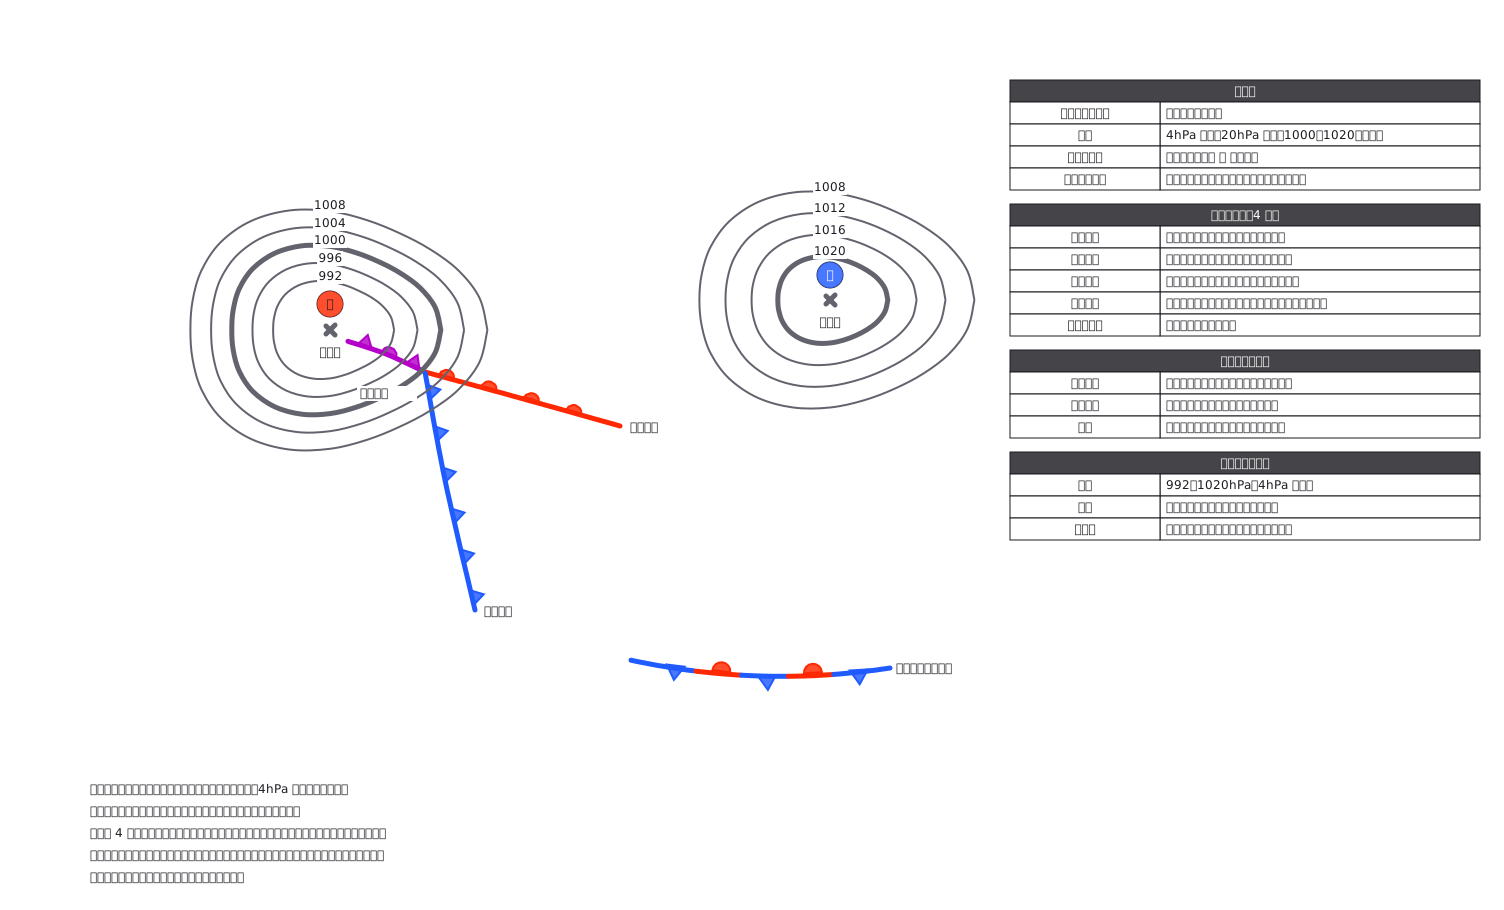 A surface chart: the barbs tell you which way the front is moving
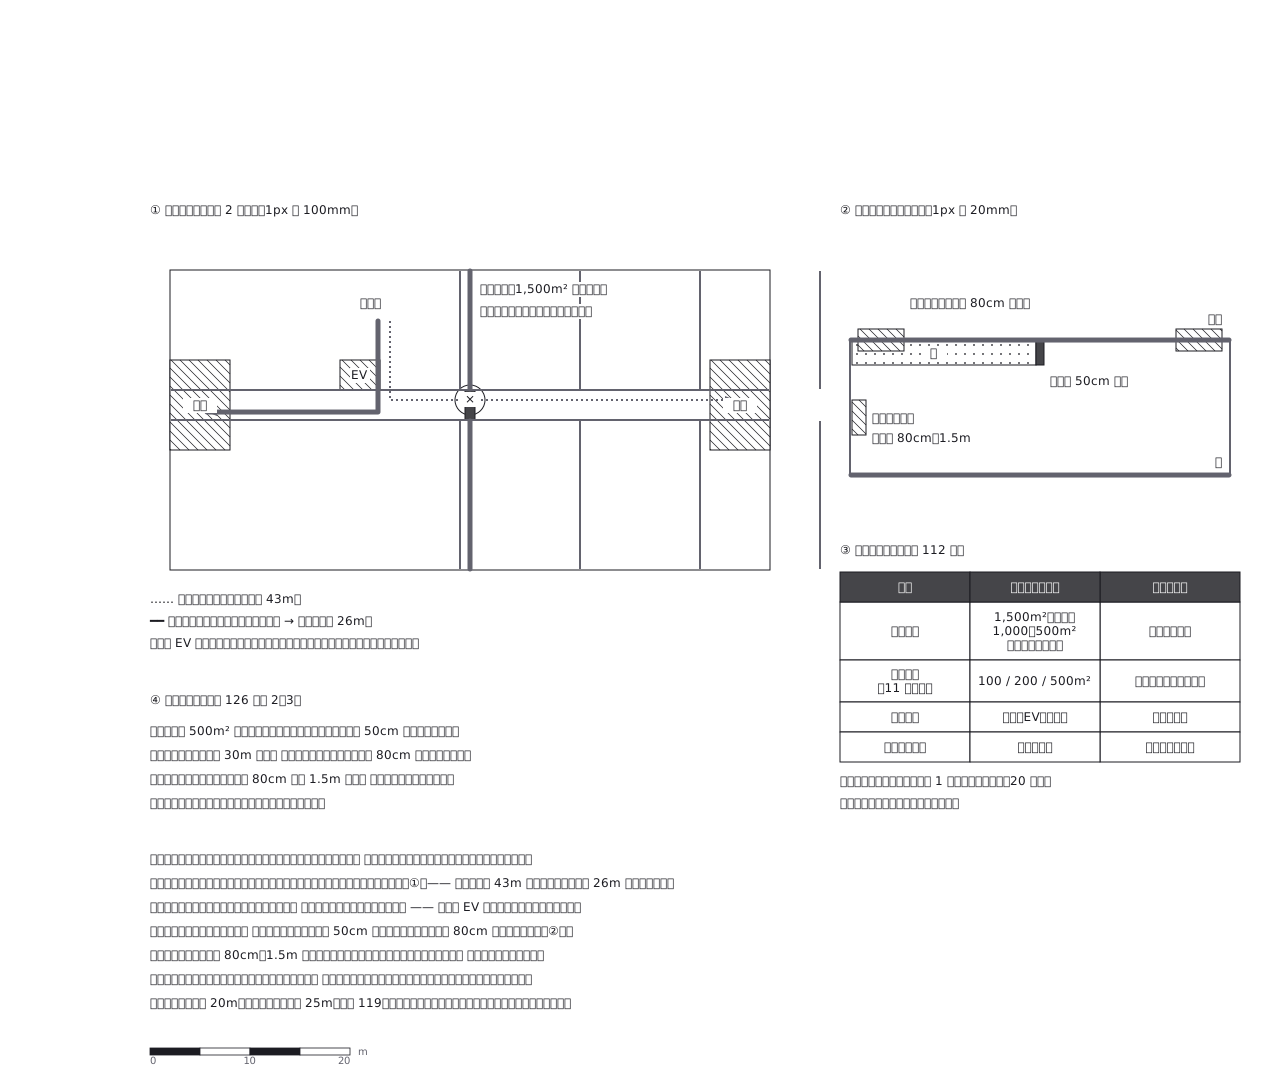 Fire compartments: the shortcut you use every day is the one that closes — a drill map must show the route after the shutters come down, not before
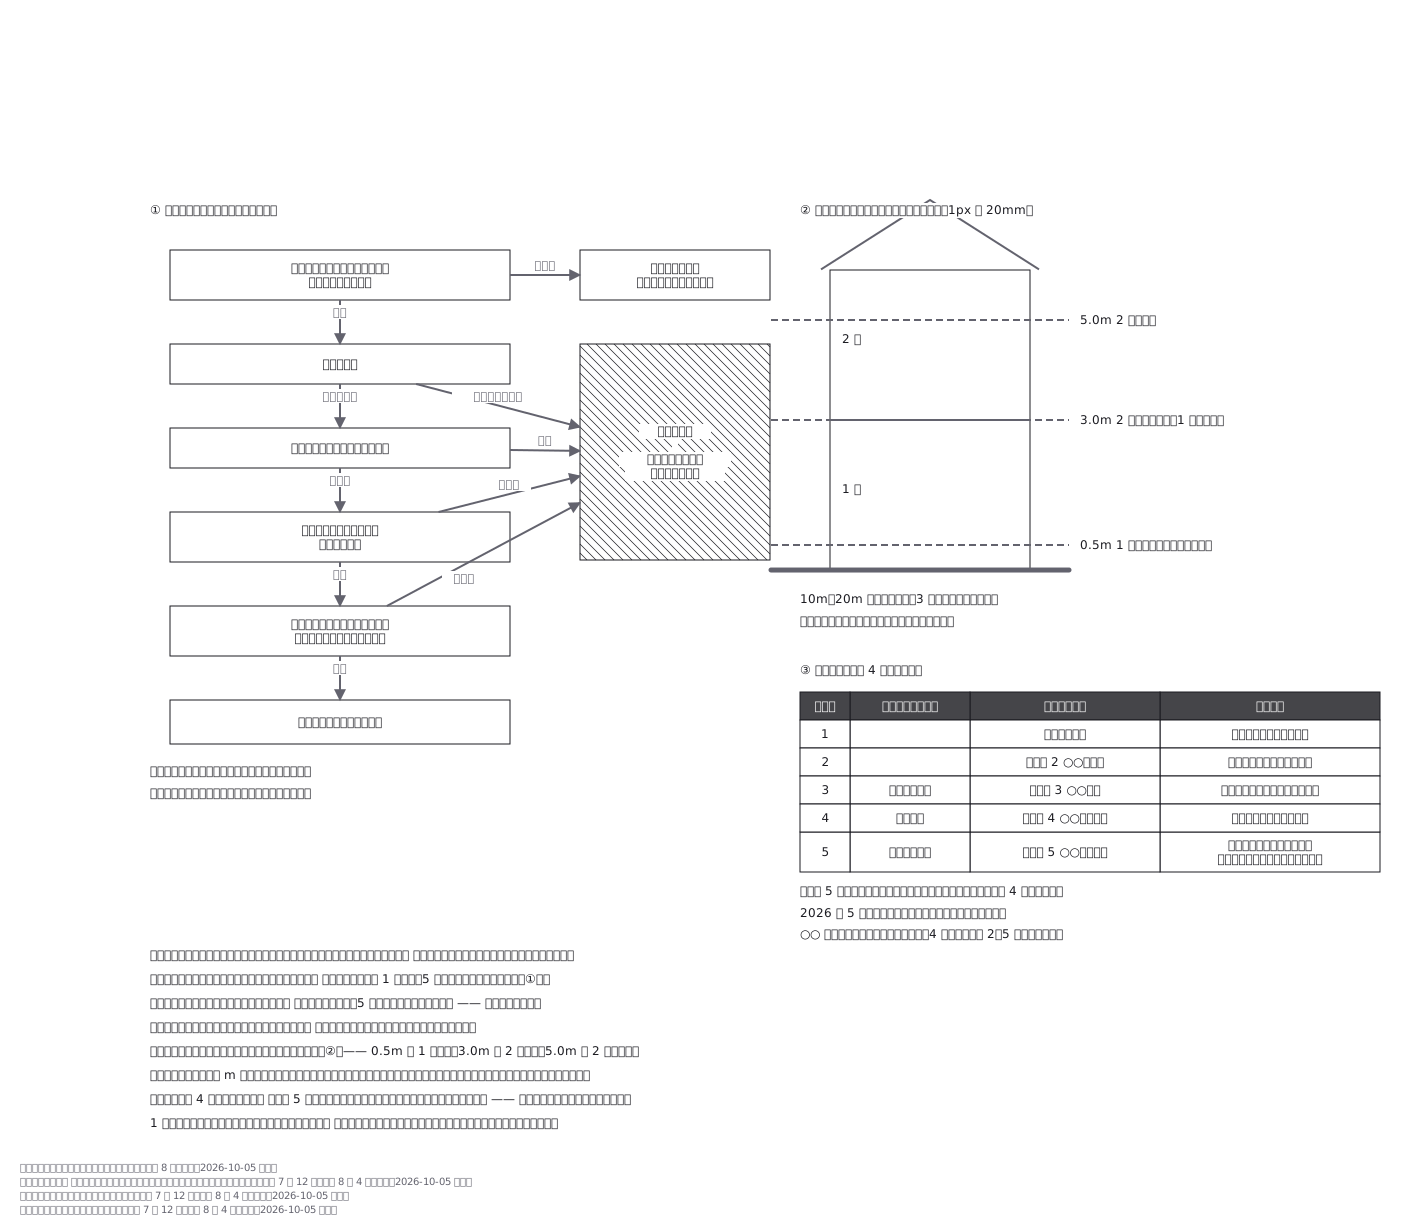 Deciding whether to leave: five questions answered once, in advance — and flood-depth bands read as floors of your own house, not as metres
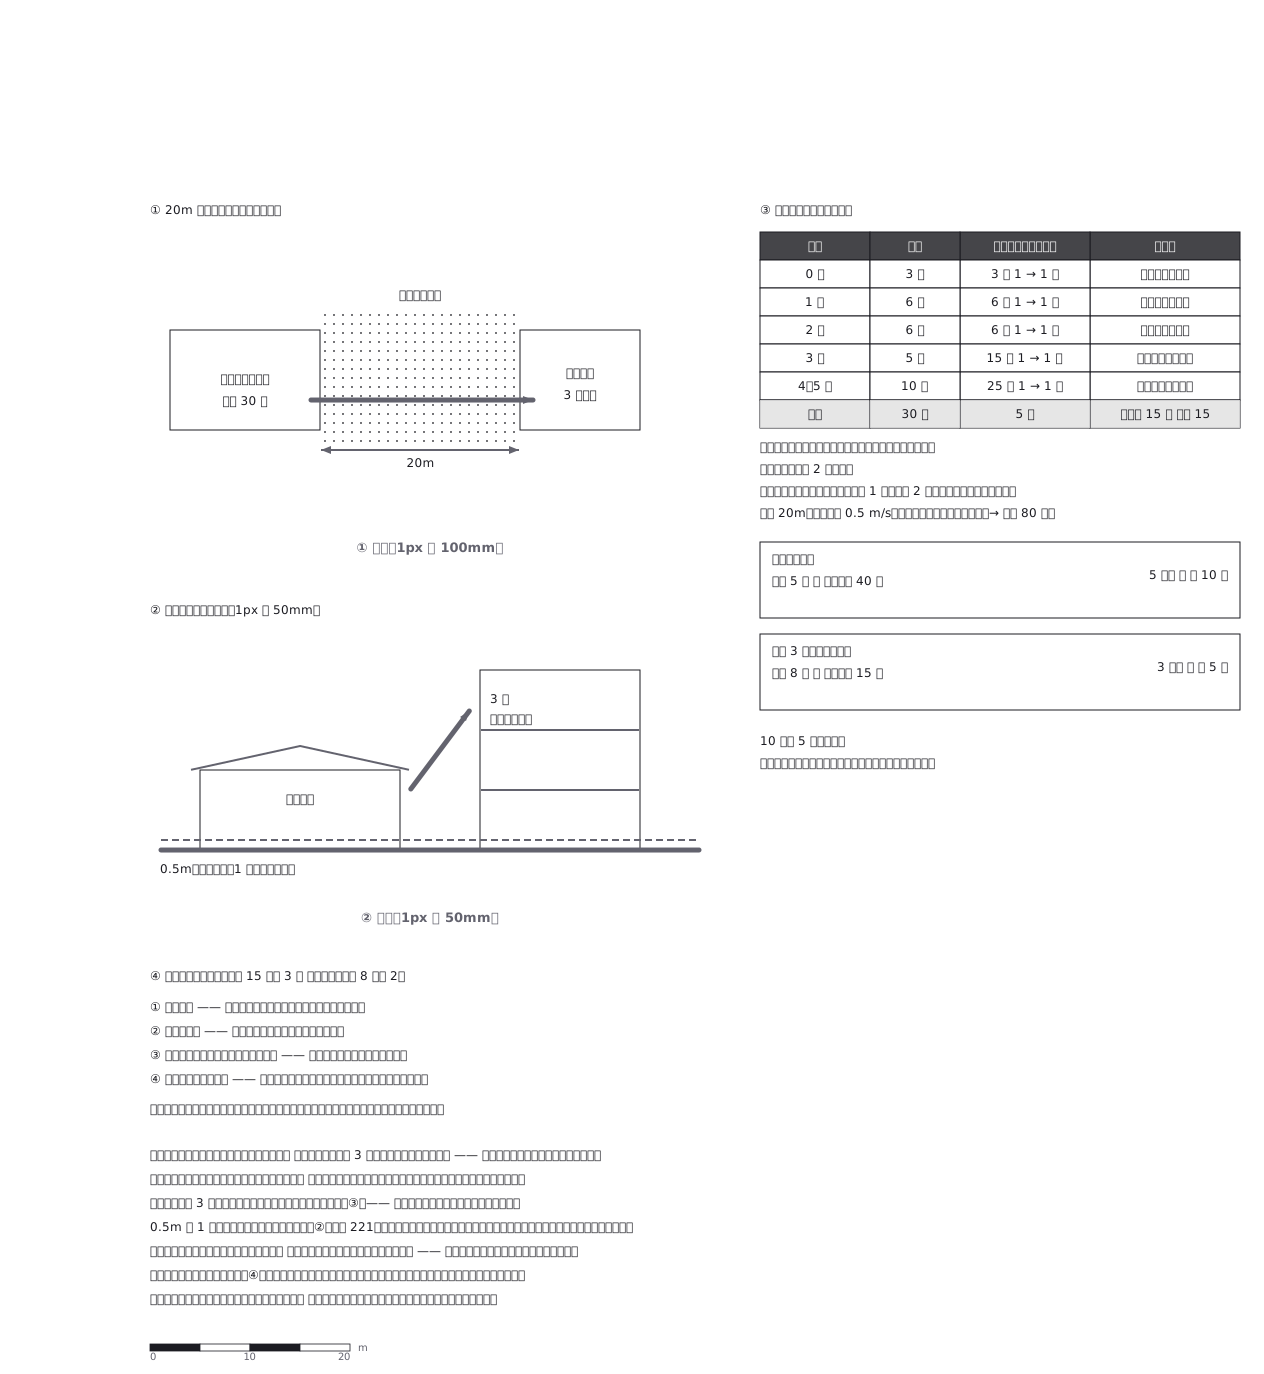 A single-storey nursery has no upstairs, so the plan is half about the building next door — and three people coming out to help halves the time the children spend outside
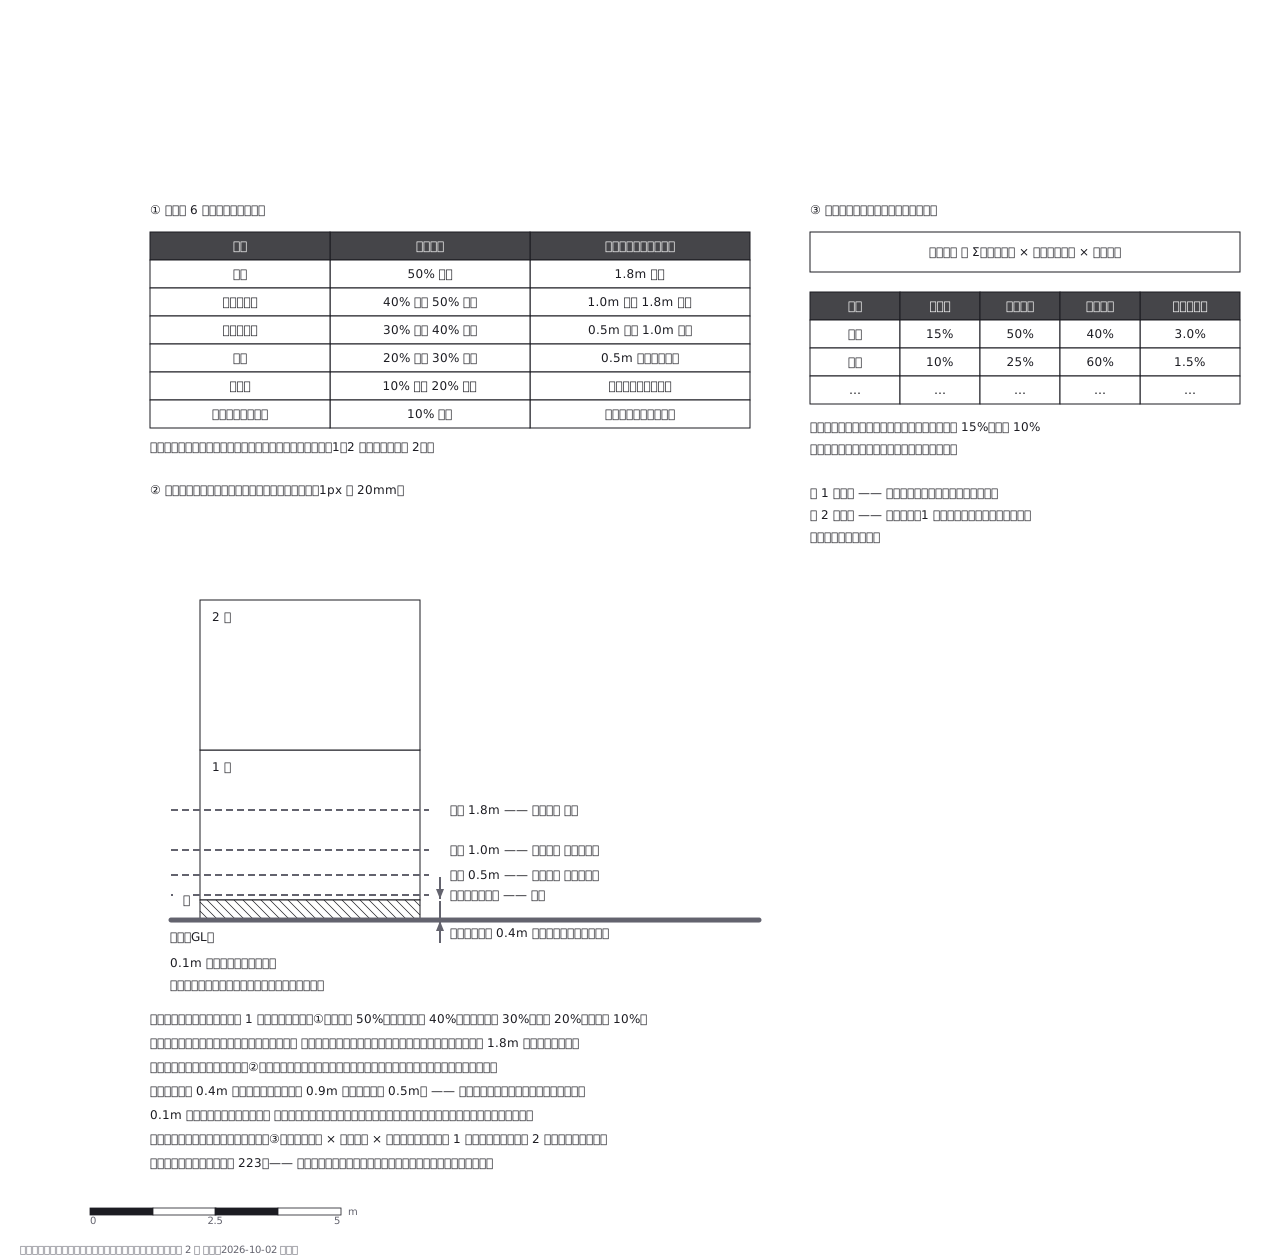 Damage certification: a hazard map measures from the ground, this measures from the floor — so the same water gives two different numbers, and 0.1m changes the category
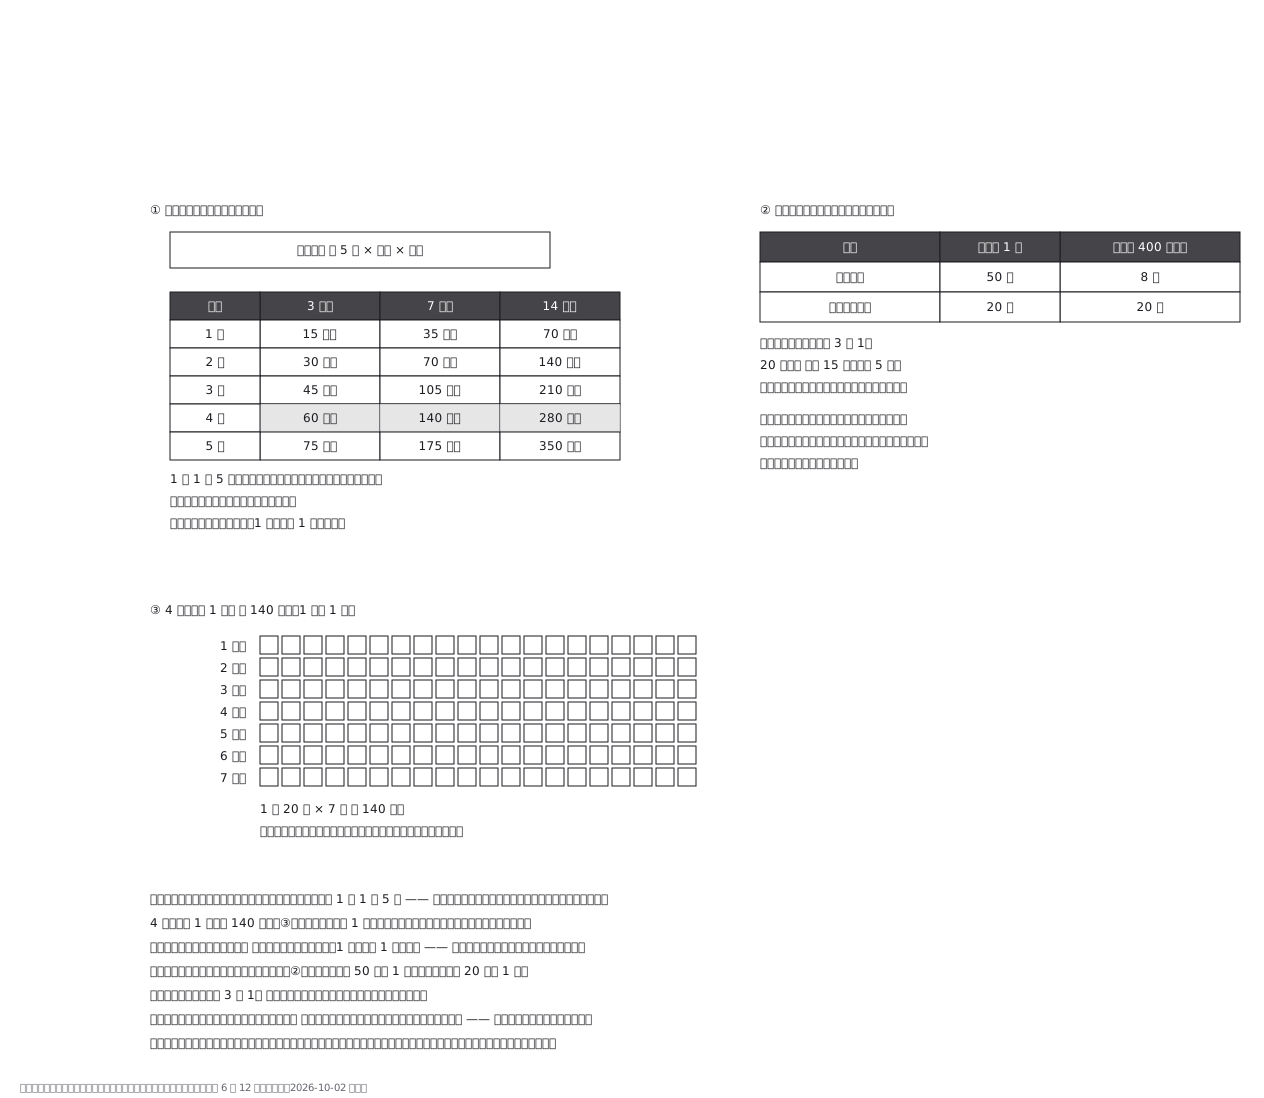 Disaster toilets are counted in uses, not litres: five per person per day, so a family of four needs 140 bags for a week — and the bags stay in the house
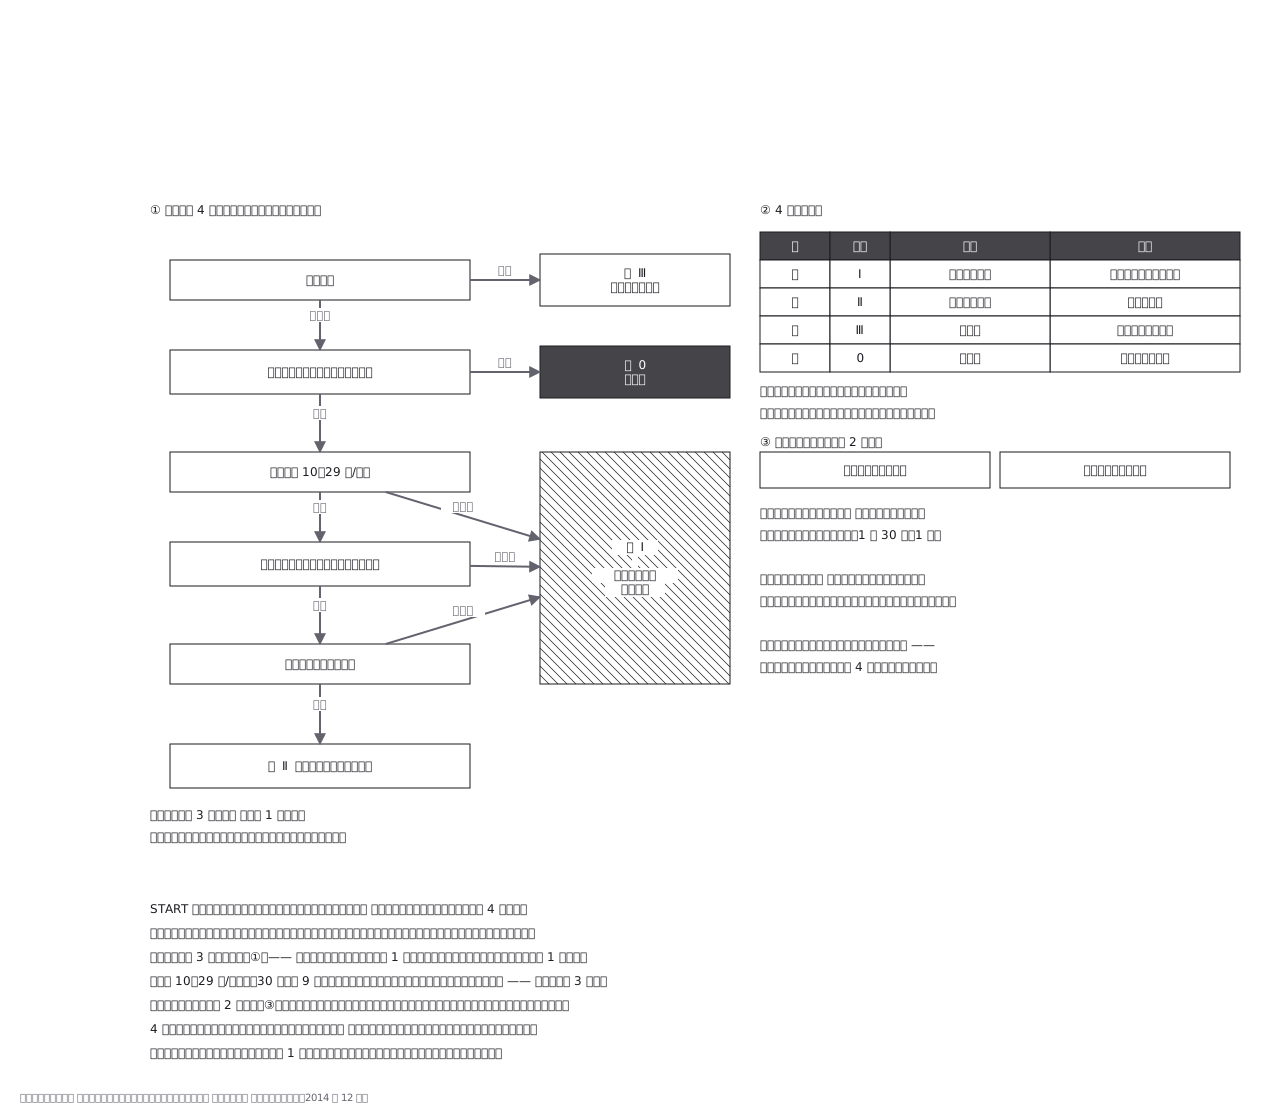 Modified START triage as used in Japan (circulation judged by the radial pulse): four things to look at, three separate roads to red, and only two treatments allowed on the spot — because stopping costs the people behind
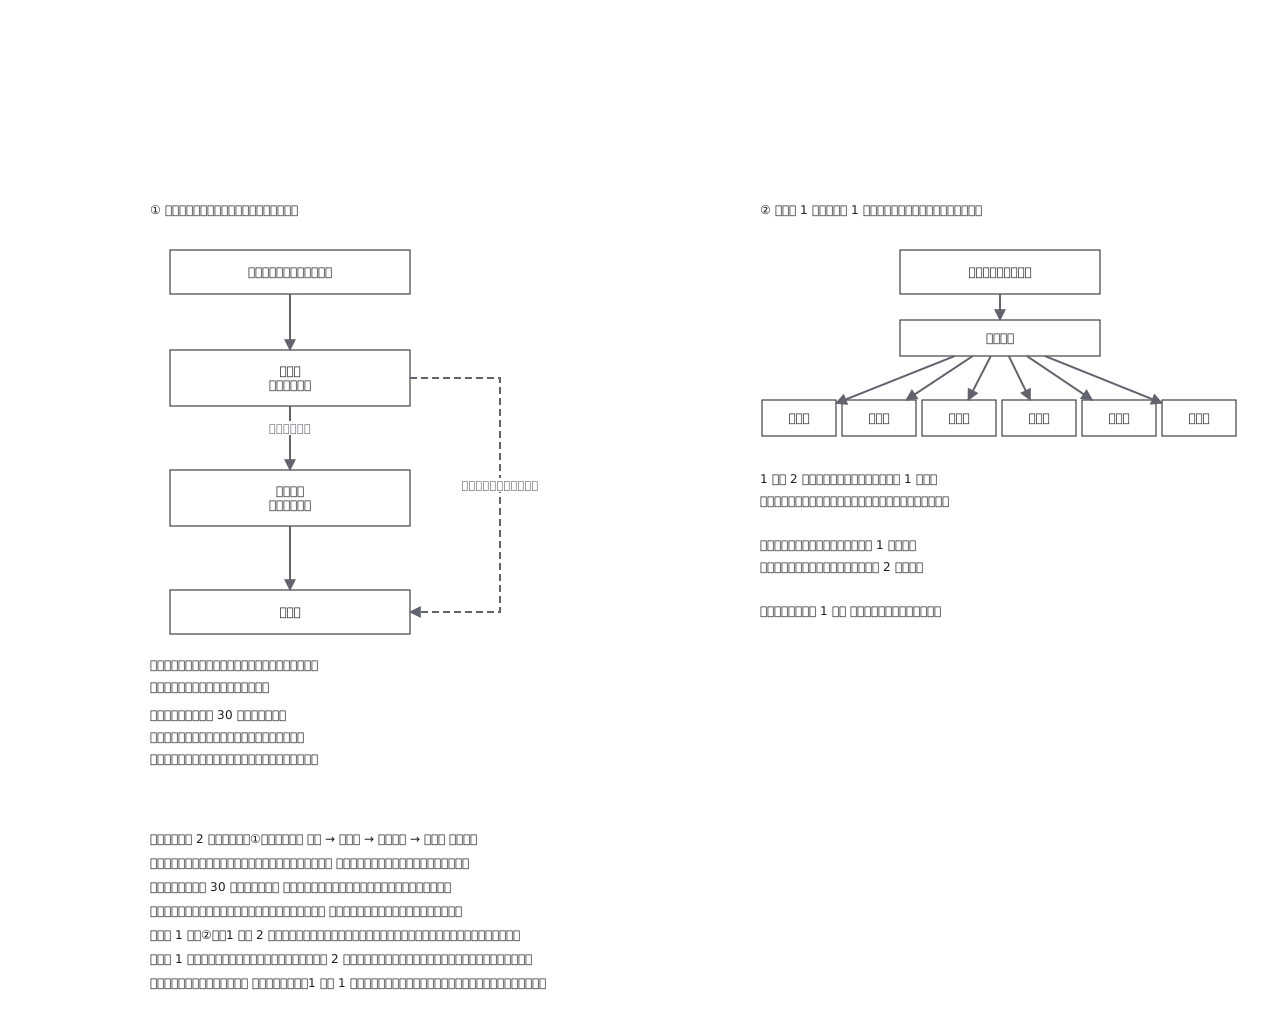 Disaster headquarters: one chain of command and one place for information, and for the biggest events the report skips a rung and goes to prefecture and nation at once
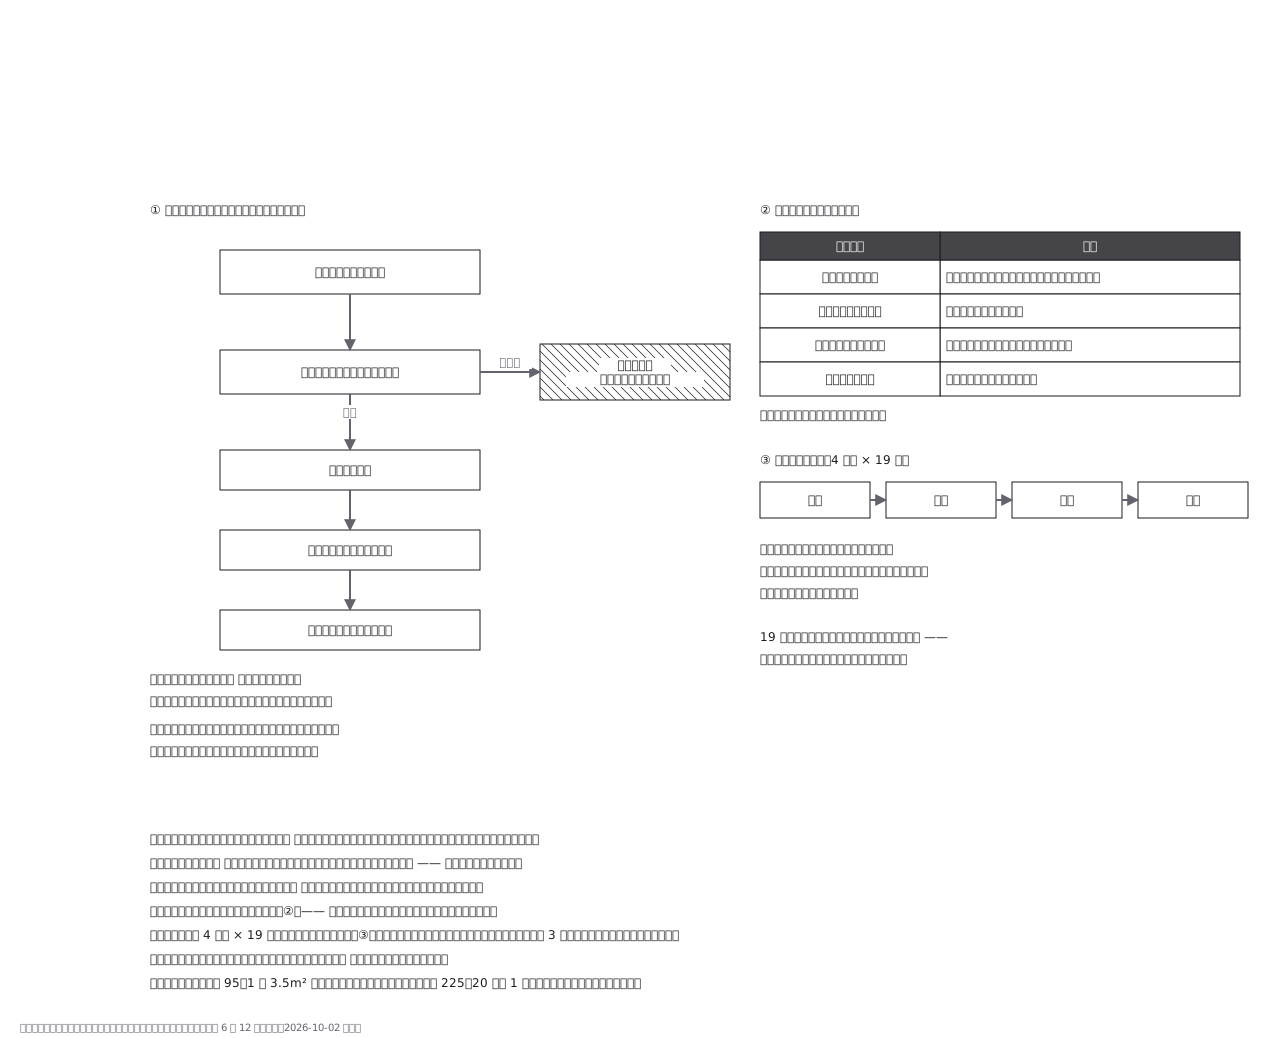 Opening a shelter starts by checking whether the building itself survived — put people in first and you may have to move them again
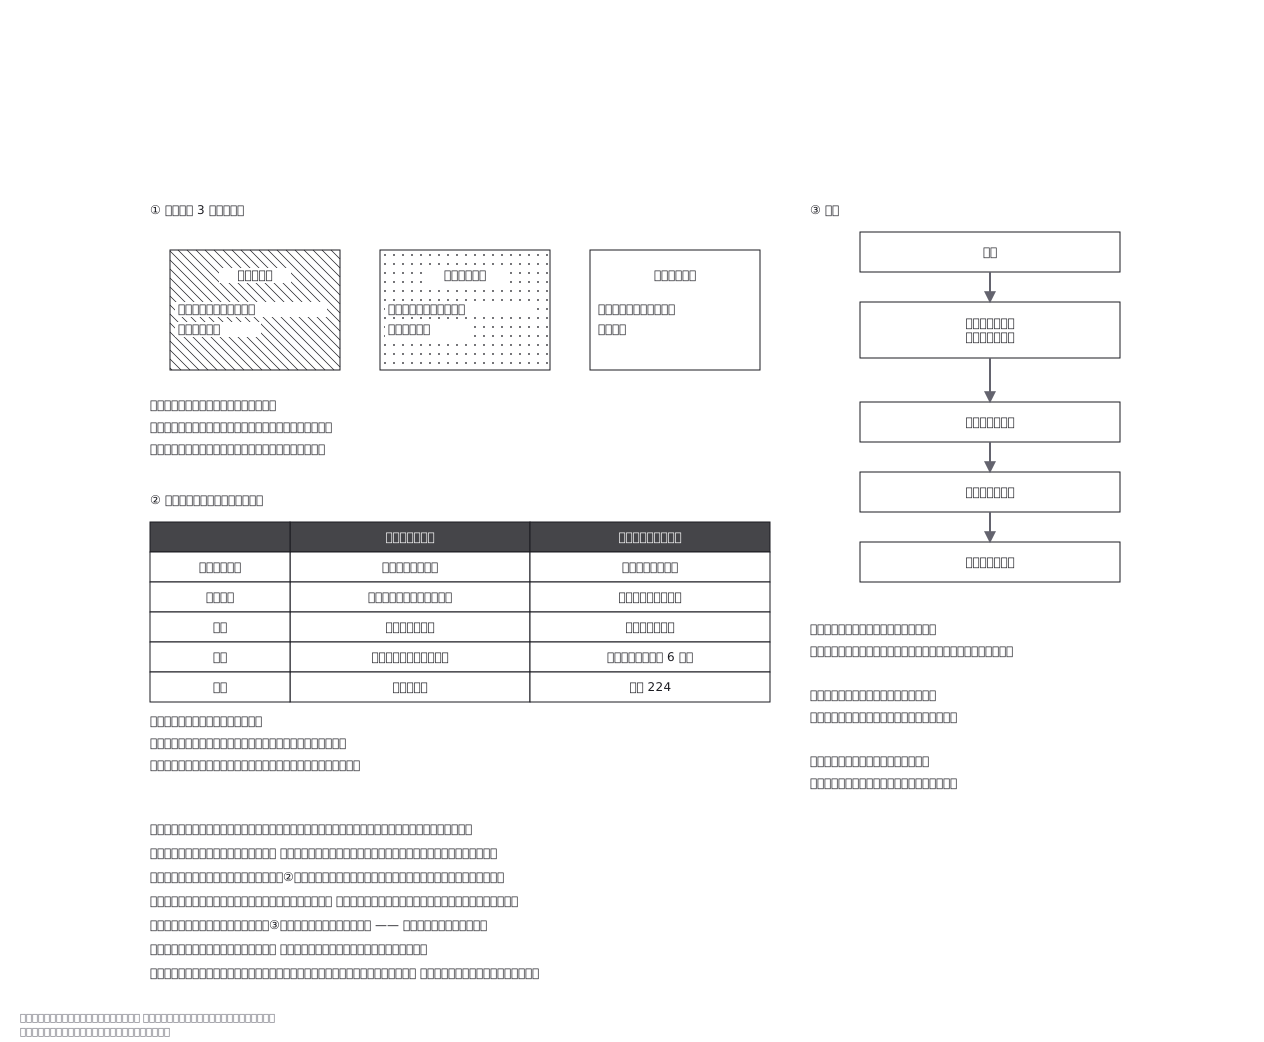 A red placard does not mean total loss: it answers whether it is safe to go in now, not how badly the building is damaged — two different papers, two different questions
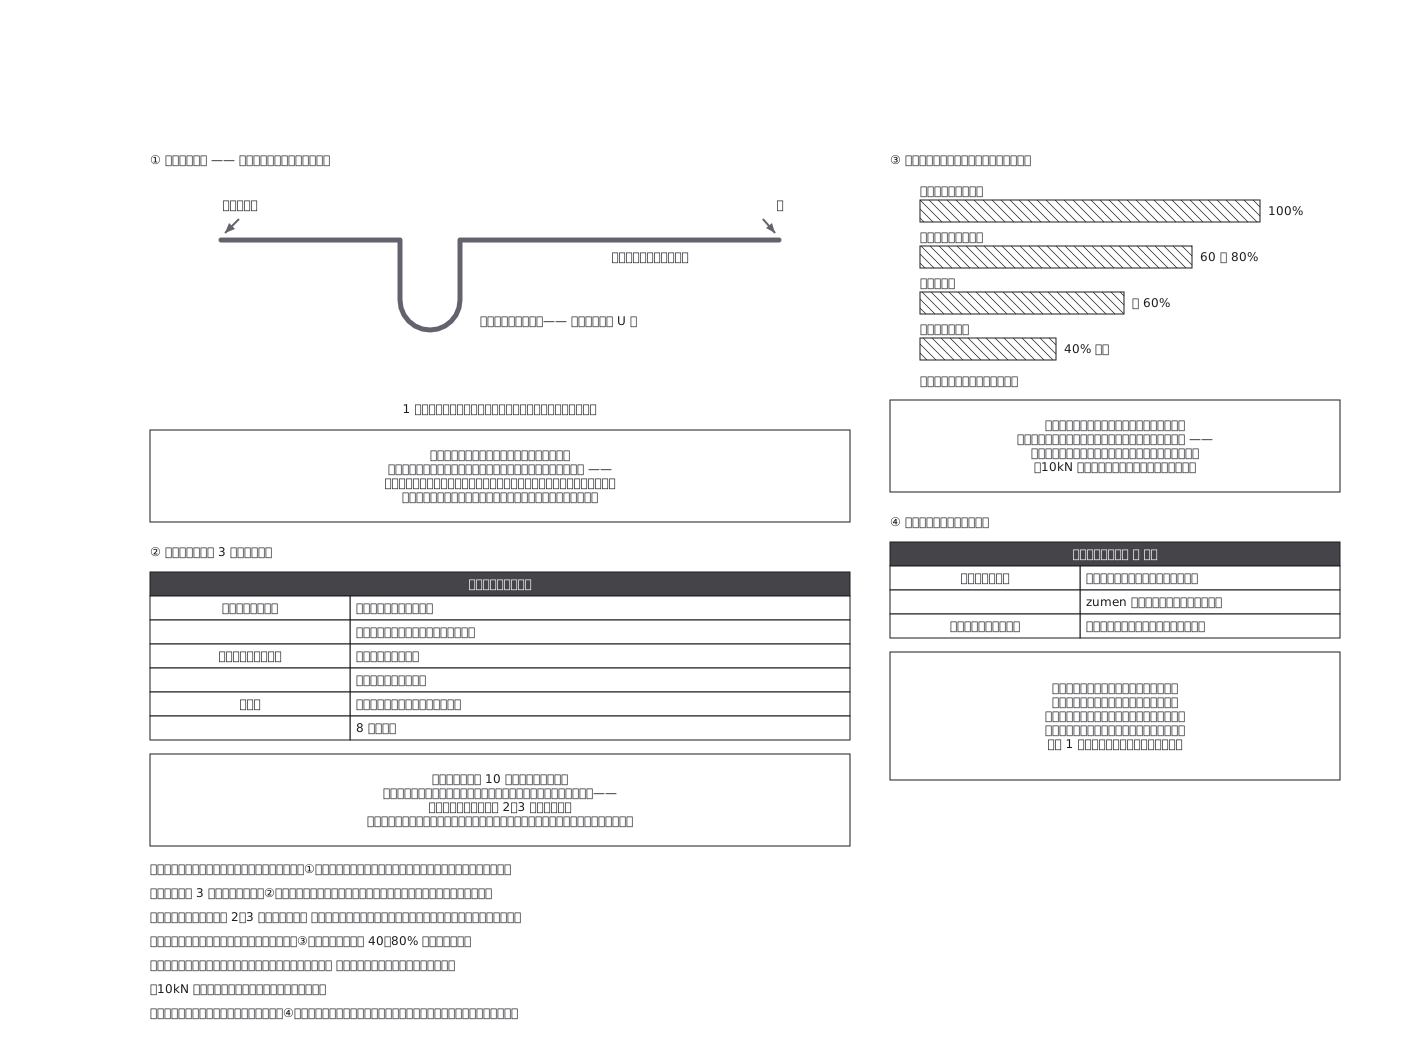 Knots are chosen by the job they do — joining two ropes, tying to an object, or stopping an end — and every knot is the weakest point of the rope, taking it down to 40-80% of its rated strength
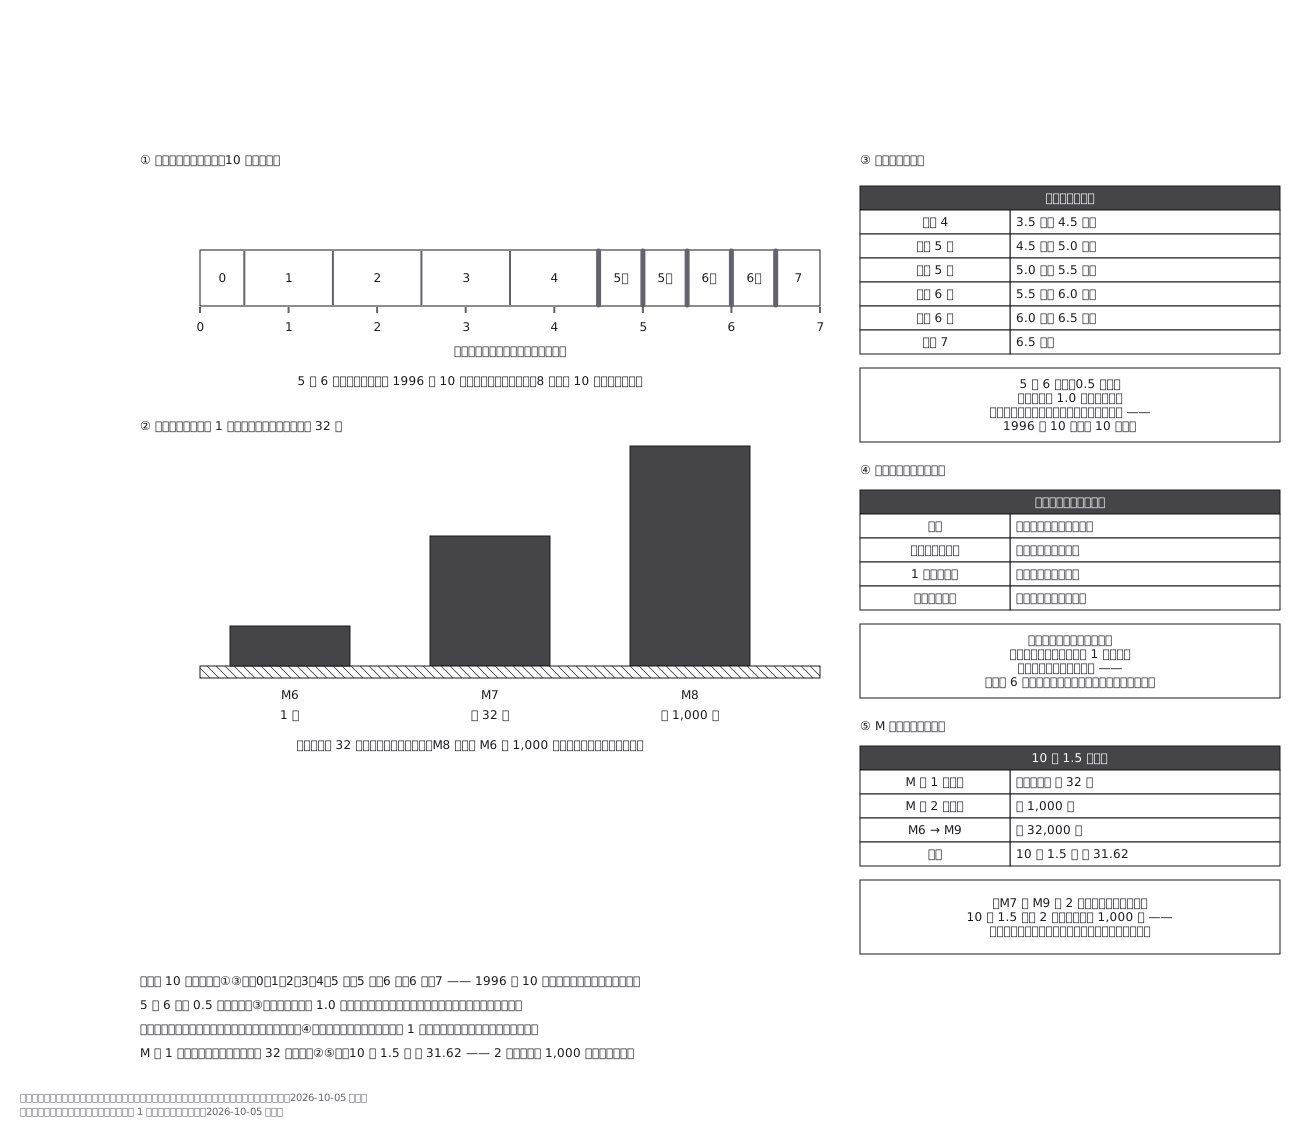 Intensity and magnitude measure different things — one earthquake has a single magnitude but as many intensities as there are places — and because each step of magnitude multiplies the energy by about 32, two steps is already a thousandfold, which is exactly what the small-looking numbers hide
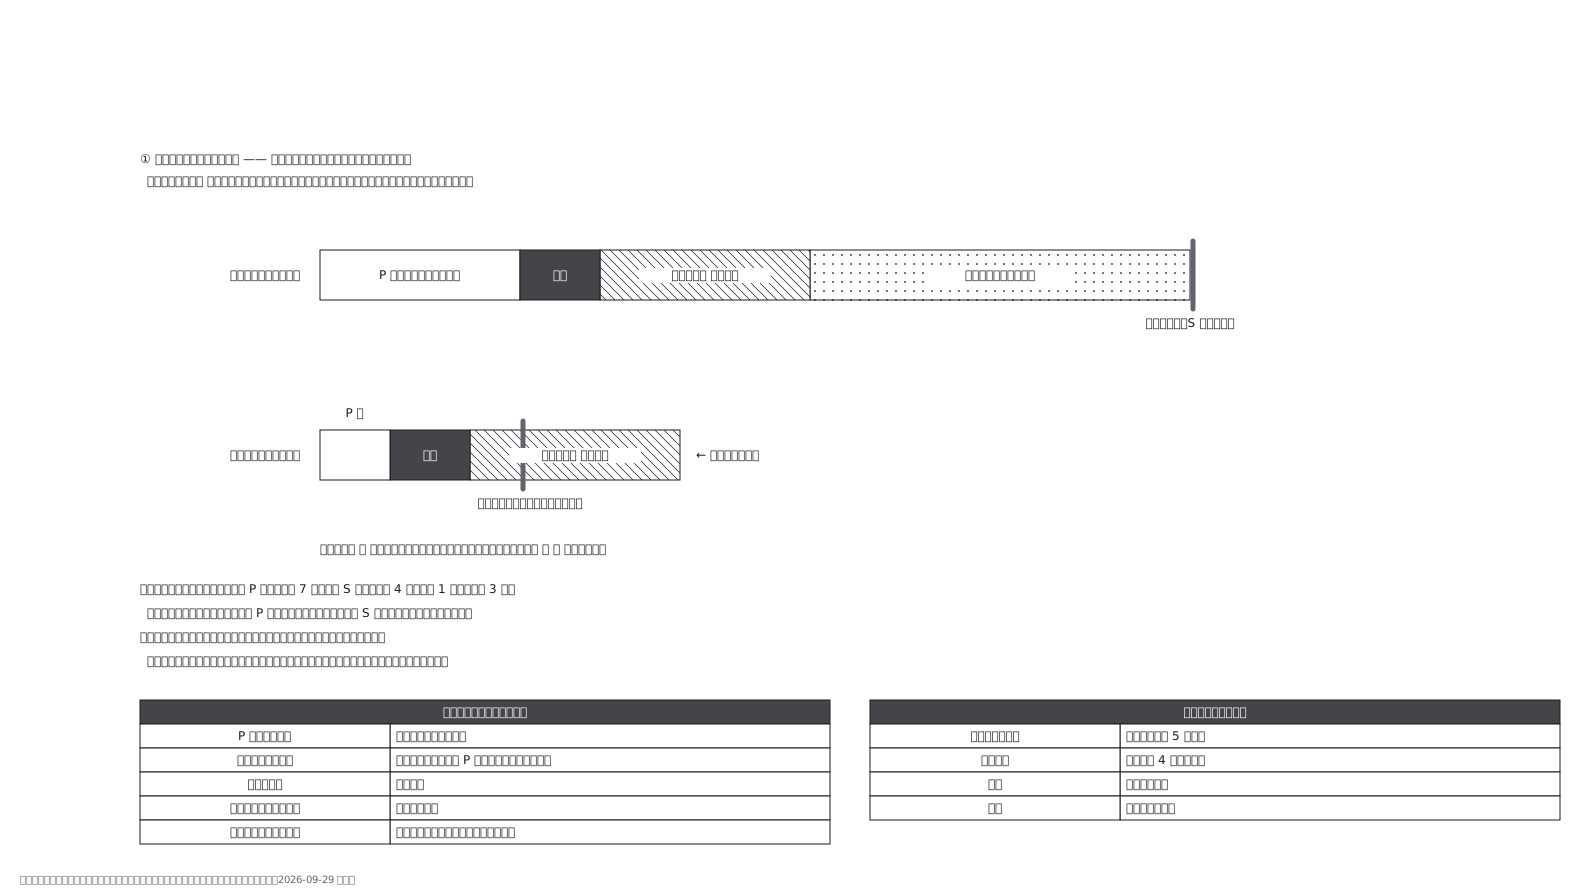 An earthquake early warning does not predict anything; it borrows the gap between the fast P wave and the slow S wave. Detection, analysis and delivery take a few seconds, and that cost is the same however far away the epicentre is — so the warning time is only what is left over, and directly beneath a shallow quake there is nothing left.
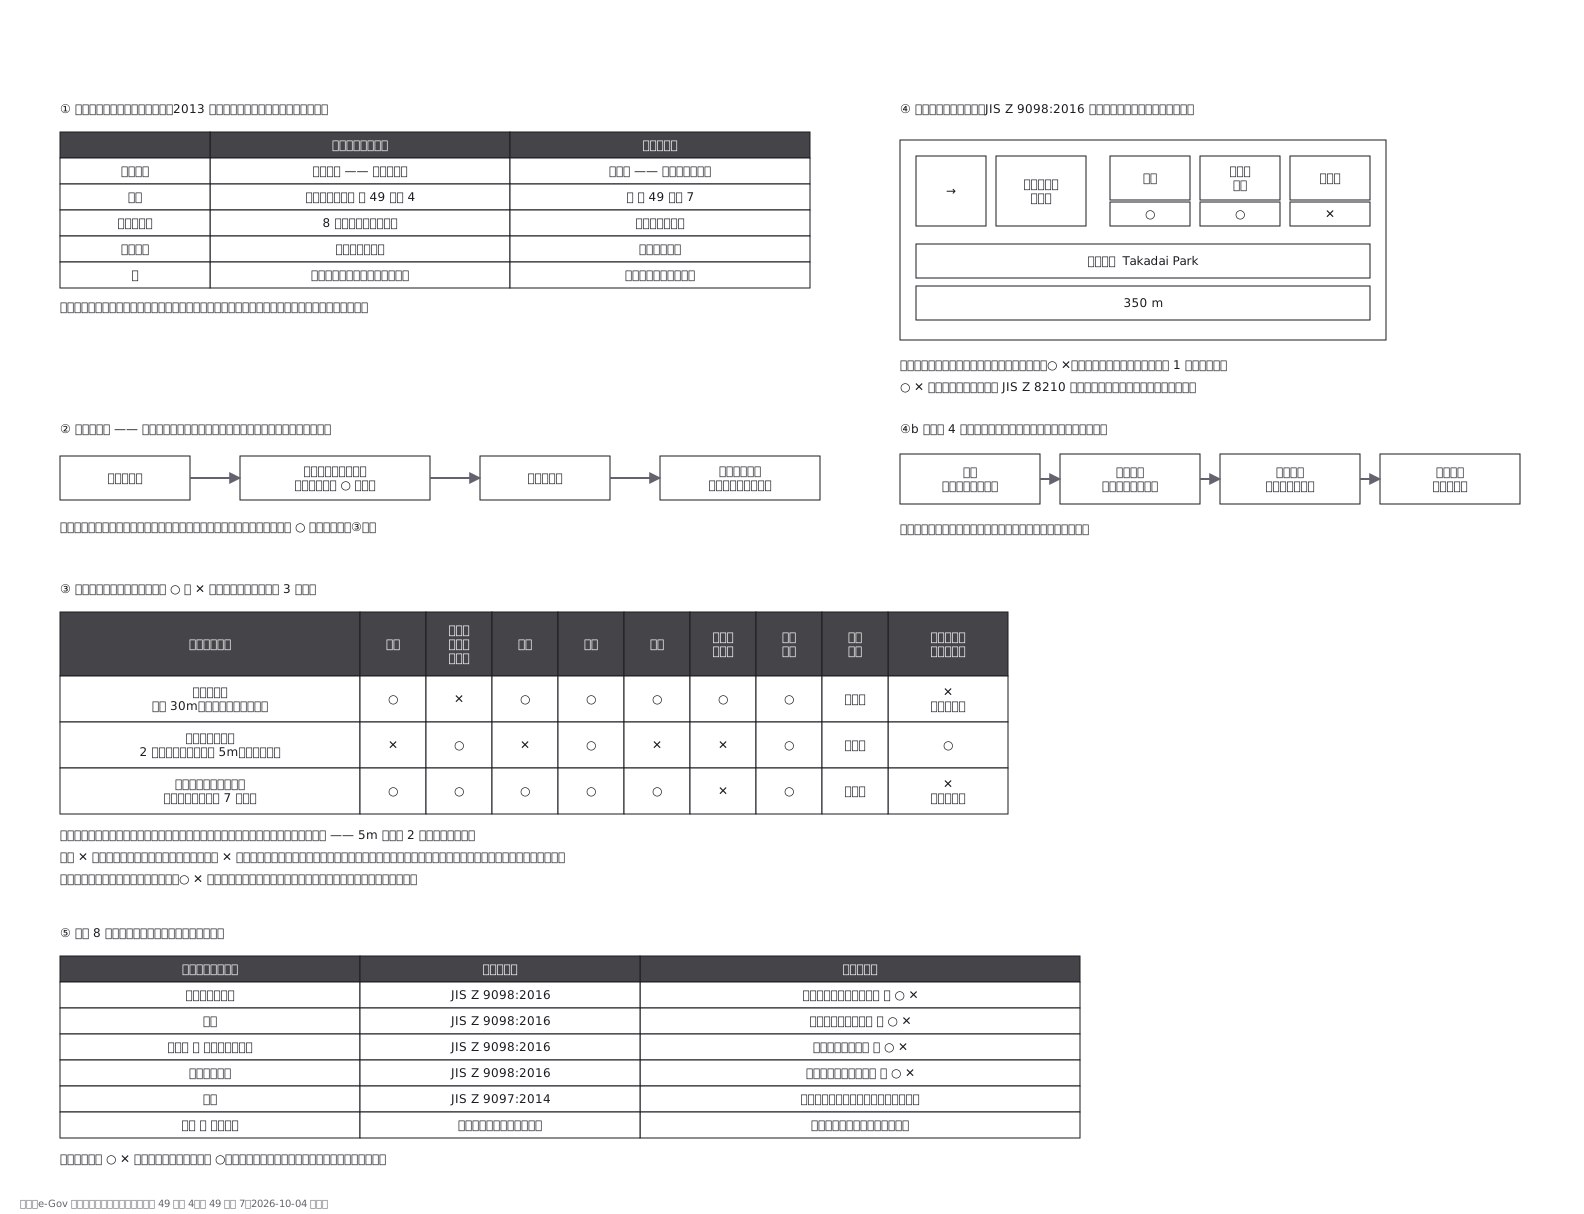 Japan separates the place you run to from the place you stay. An emergency evacuation site is designated per hazard, eight of them; a shelter is where you live when you cannot go home. One school can be a shelter yet wrong for a flood. Three fictional sites are marked per hazard, with the parts of a JIS Z 9098 sign and which hazards have no sign system at all.
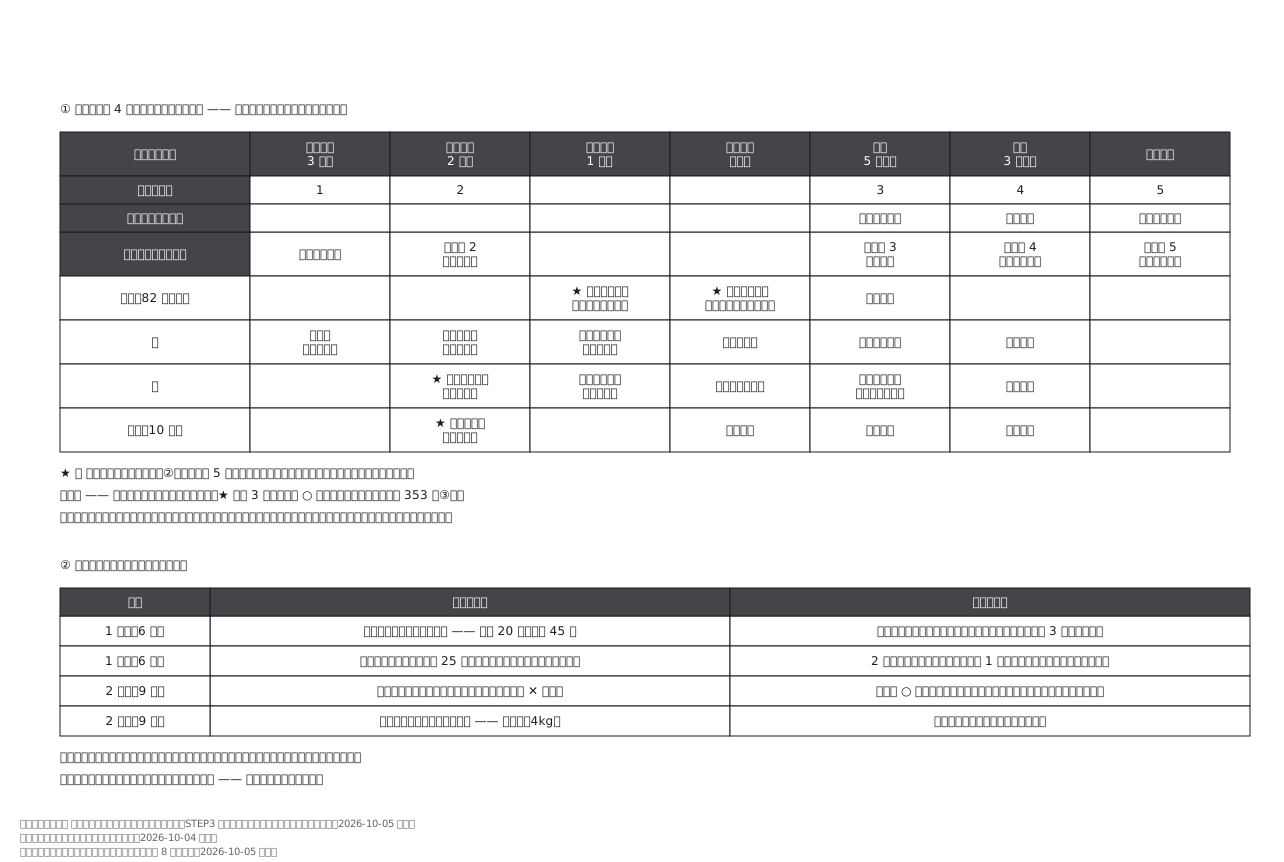 A family evacuation timeline for a typhoon, from three days out to the river overflowing, one row per person, cued by alert level rather than by the clock. Below it, what two drills measured and what was changed: the grandmother took 45 minutes on foot, not 20, so she now leaves half a day early by car. The version opened on the day is the one the last drill corrected.
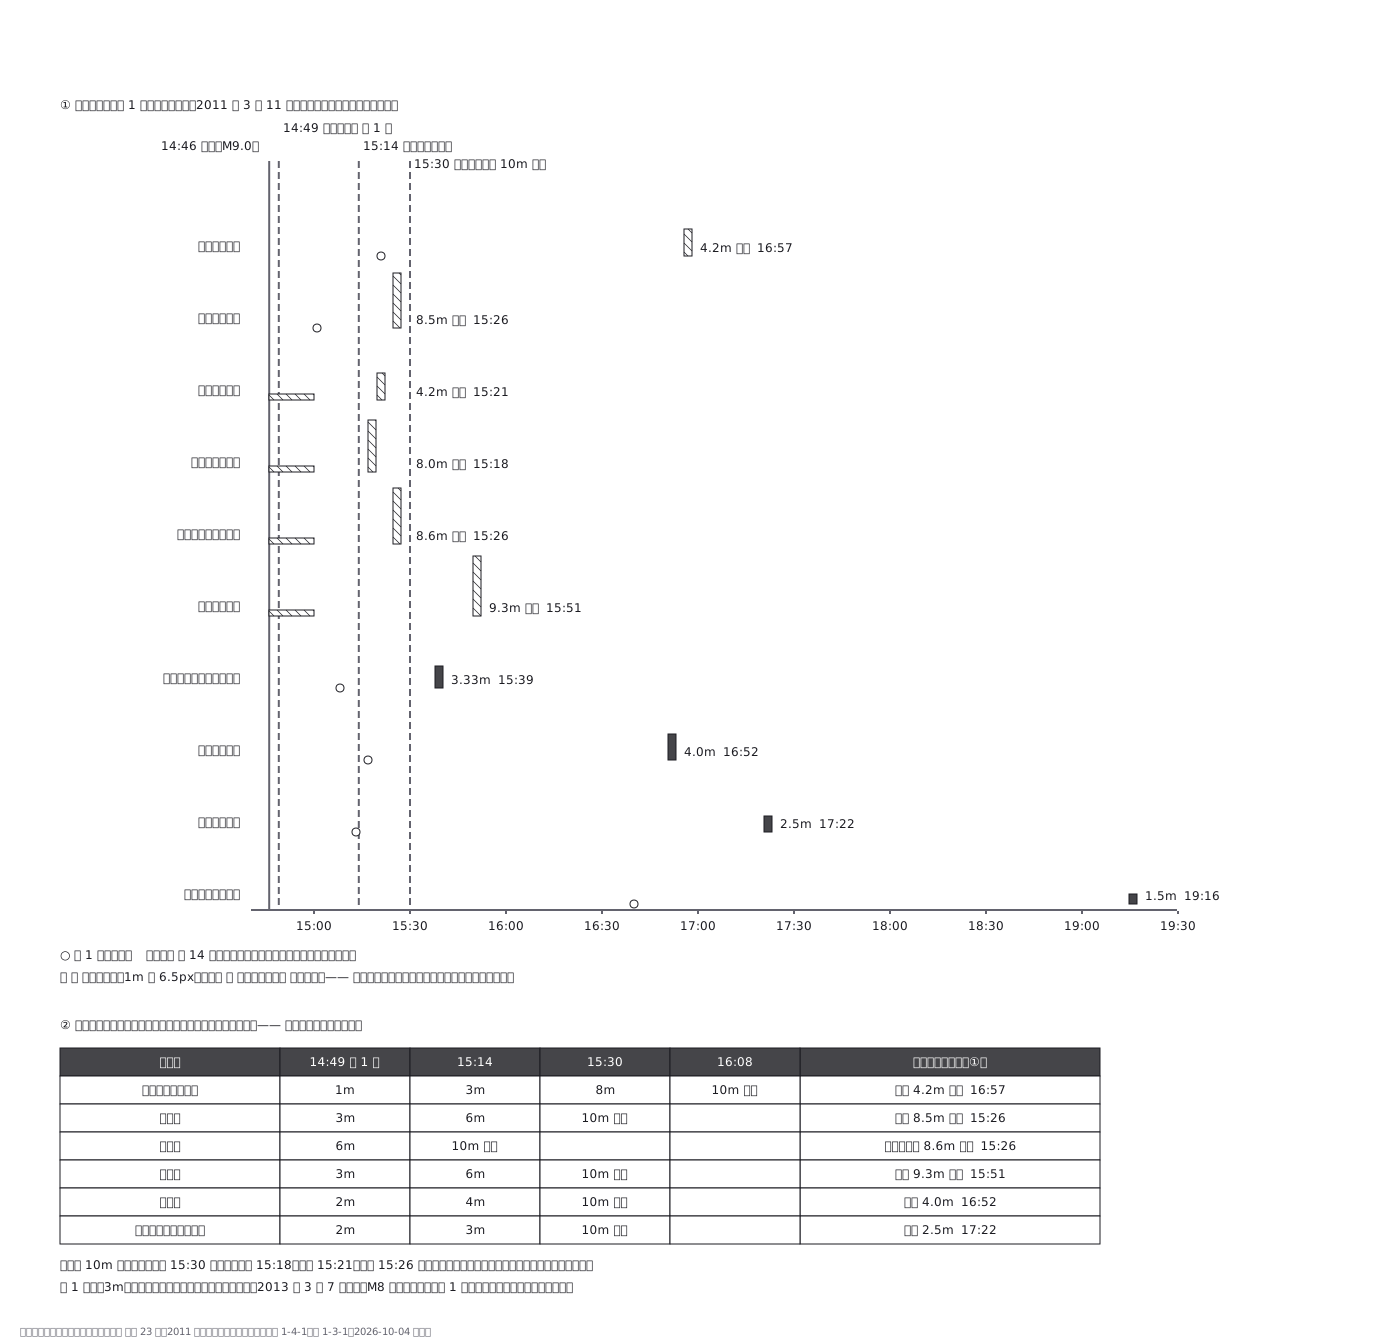 The 11 March 2011 tsunami at ten Pacific tide gauges, north to south: first wave and highest wave on one time axis, from the Japan Meteorological Agency record. Hatched bars mean at least: the gauge broke or went off the scale. The first warning at 14:49 forecast 3 m for Iwate; it rose to over 10 m at 15:30, after the highest waves had struck Ofunato, Kamaishi and Miyako.
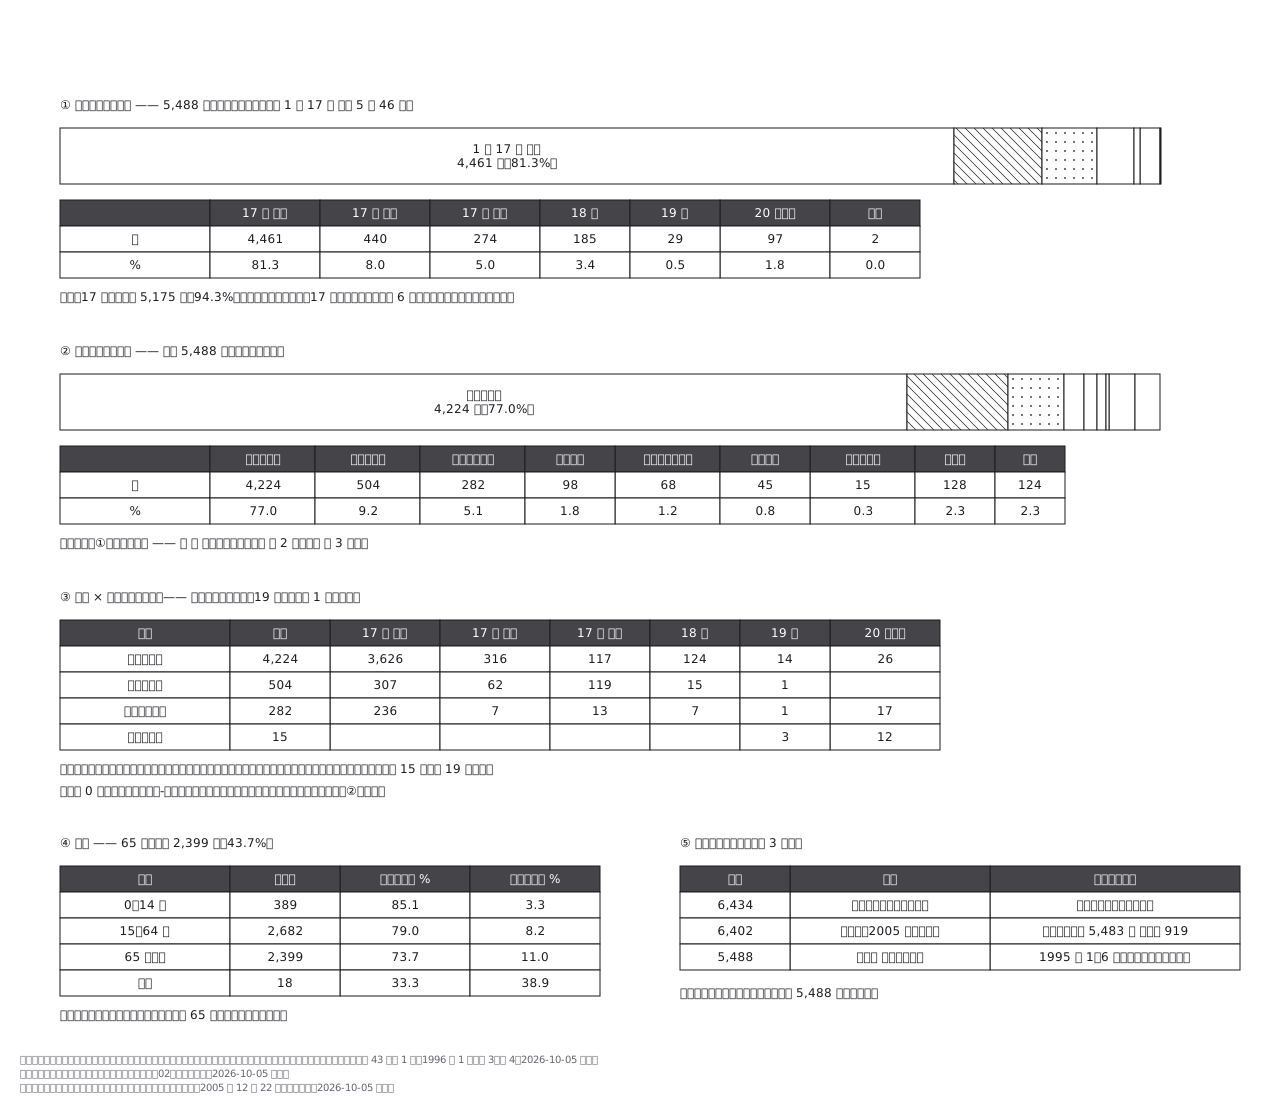 The 5,488 deaths of the 1995 Kobe earthquake in the national vital statistics, as two proportional bands: 81.3 per cent died on the morning of 17 January, 77.0 per cent of asphyxia or crushing. Crossing cause with date shows that all fifteen deaths from crush syndrome came on the 19th or later, after rescue. A table explains why the death toll is quoted three ways.
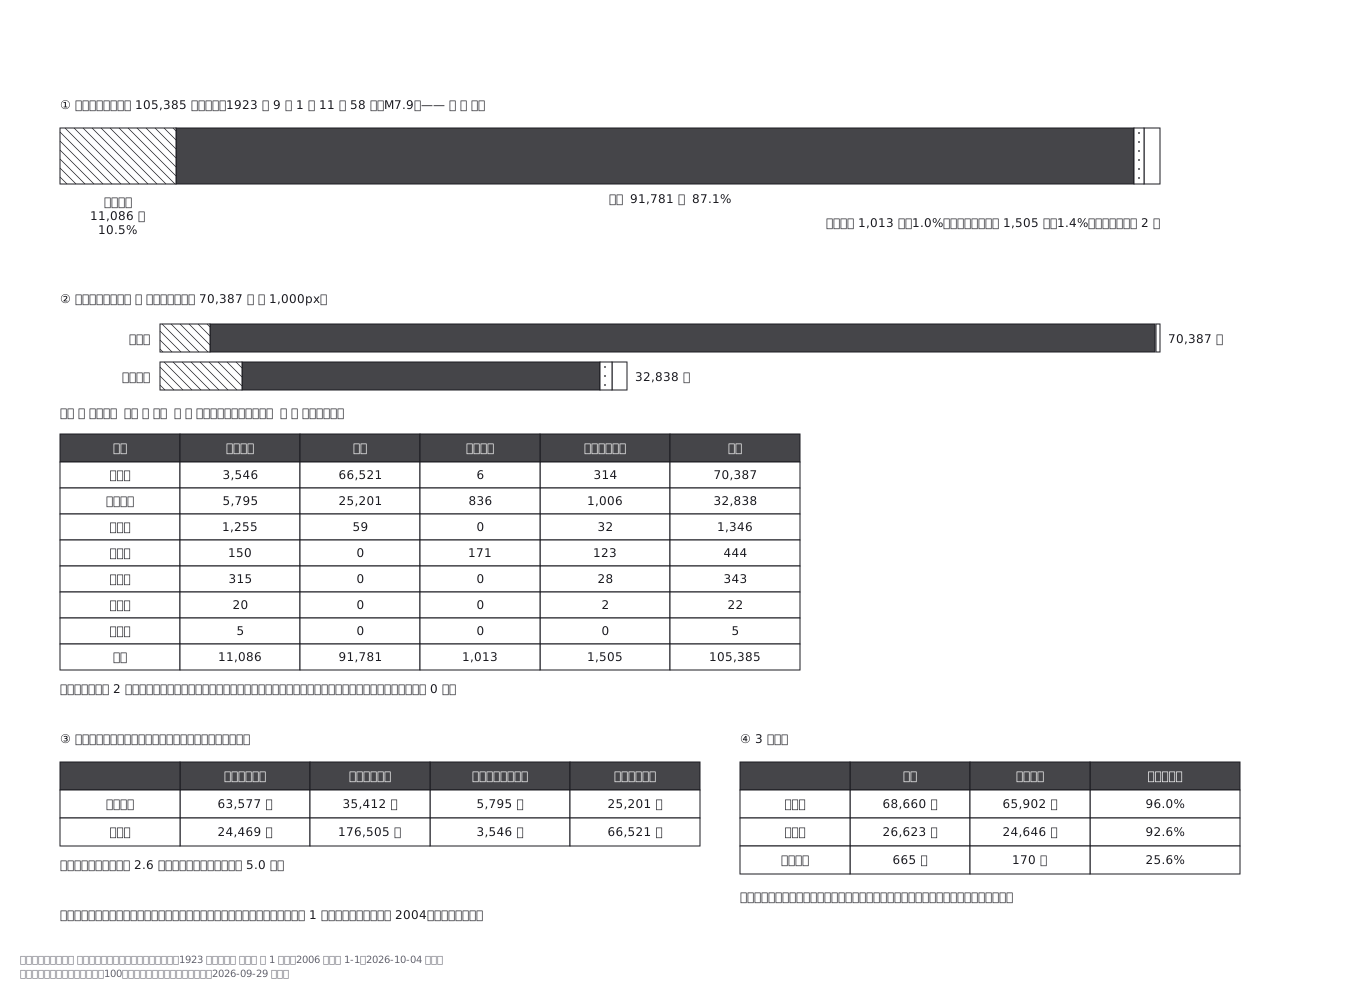 The 105,385 dead and missing of the 1923 Great Kanto earthquake by cause: 91,781, or 87.1 per cent, died in fire. Kanagawa had 2.6 times as many houses collapse as Tokyo, but Tokyo had 5.0 times as many burn, and 96 per cent of Tokyo city's dead were fire deaths. Figures follow the single tally the Cabinet Office report cites.
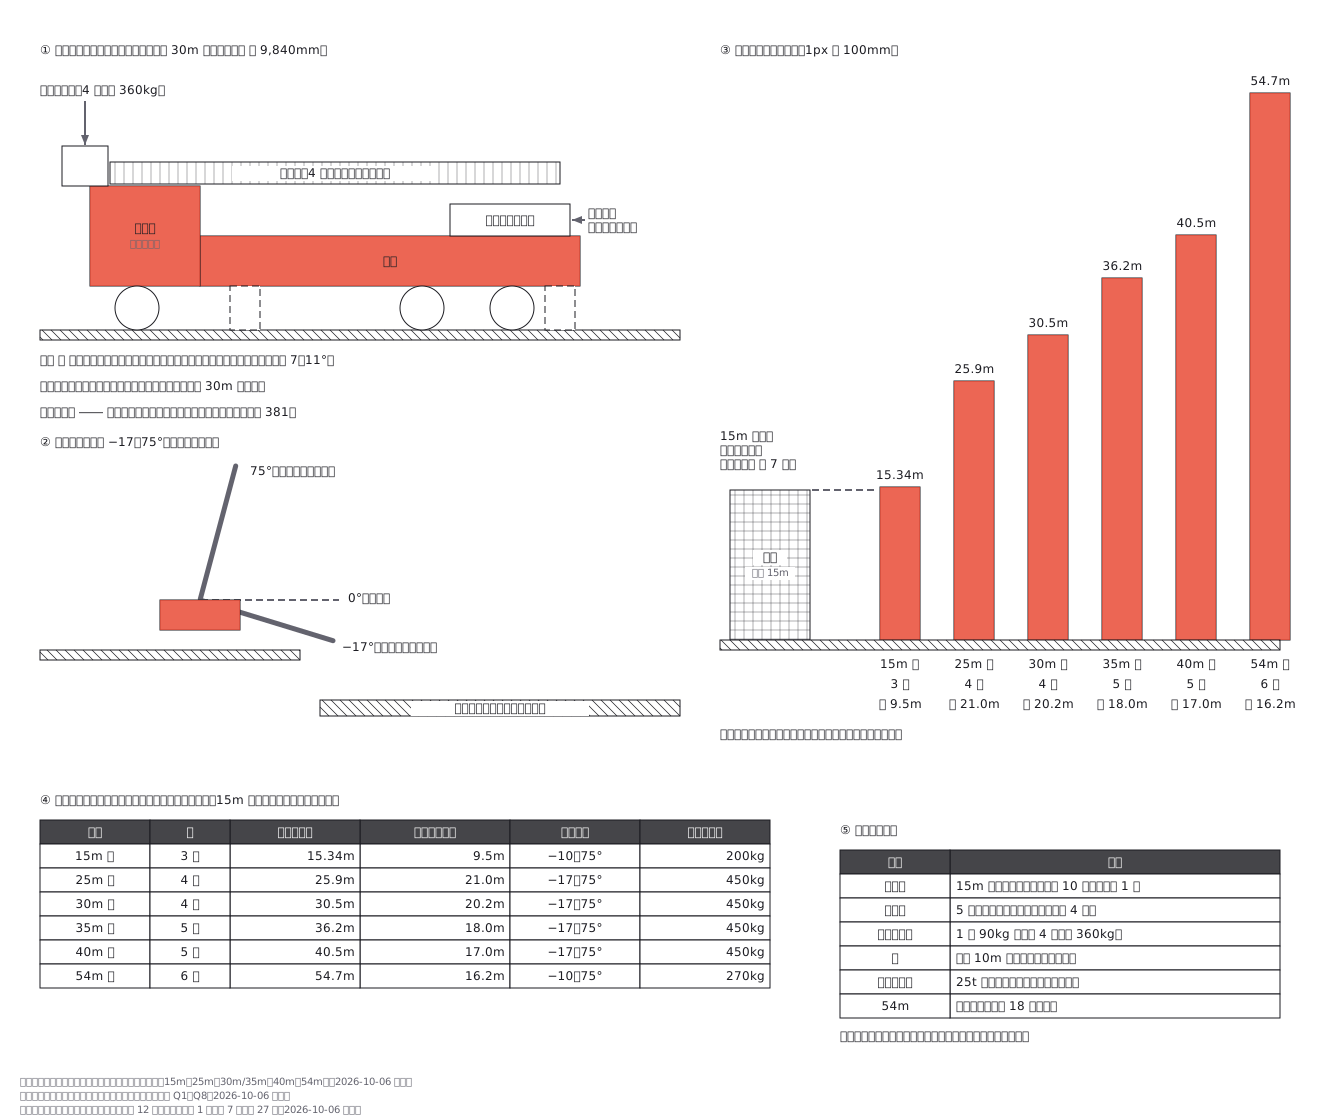 Aerial ladder trucks: what sits on the chassis, how far each model reaches, and why the longest ladders reach the least distance sideways
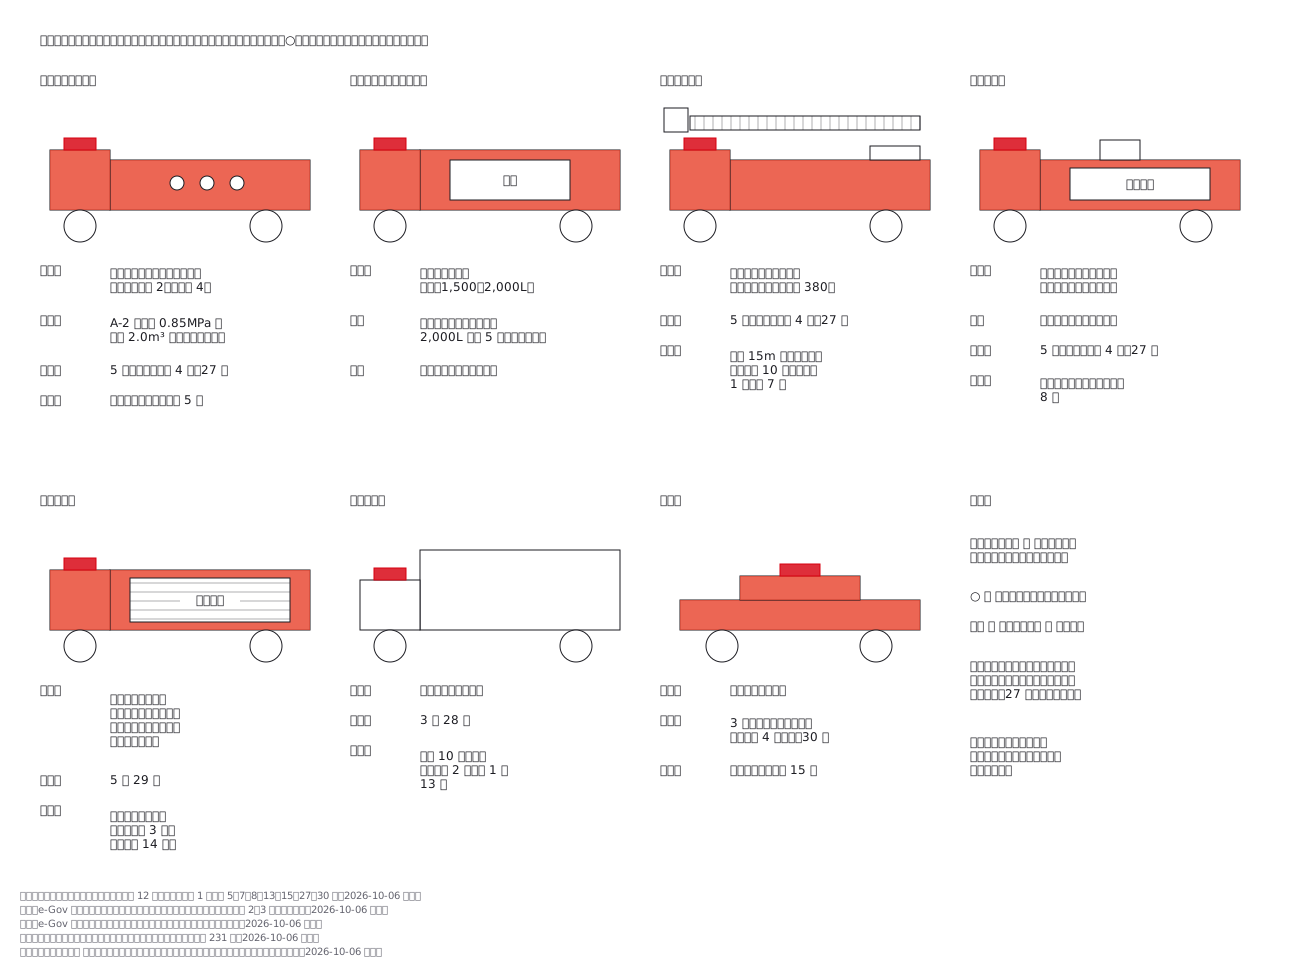 Telling Japanese fire apparatus apart: what each one carries, how many crew ride it, and how many a fire station is meant to have
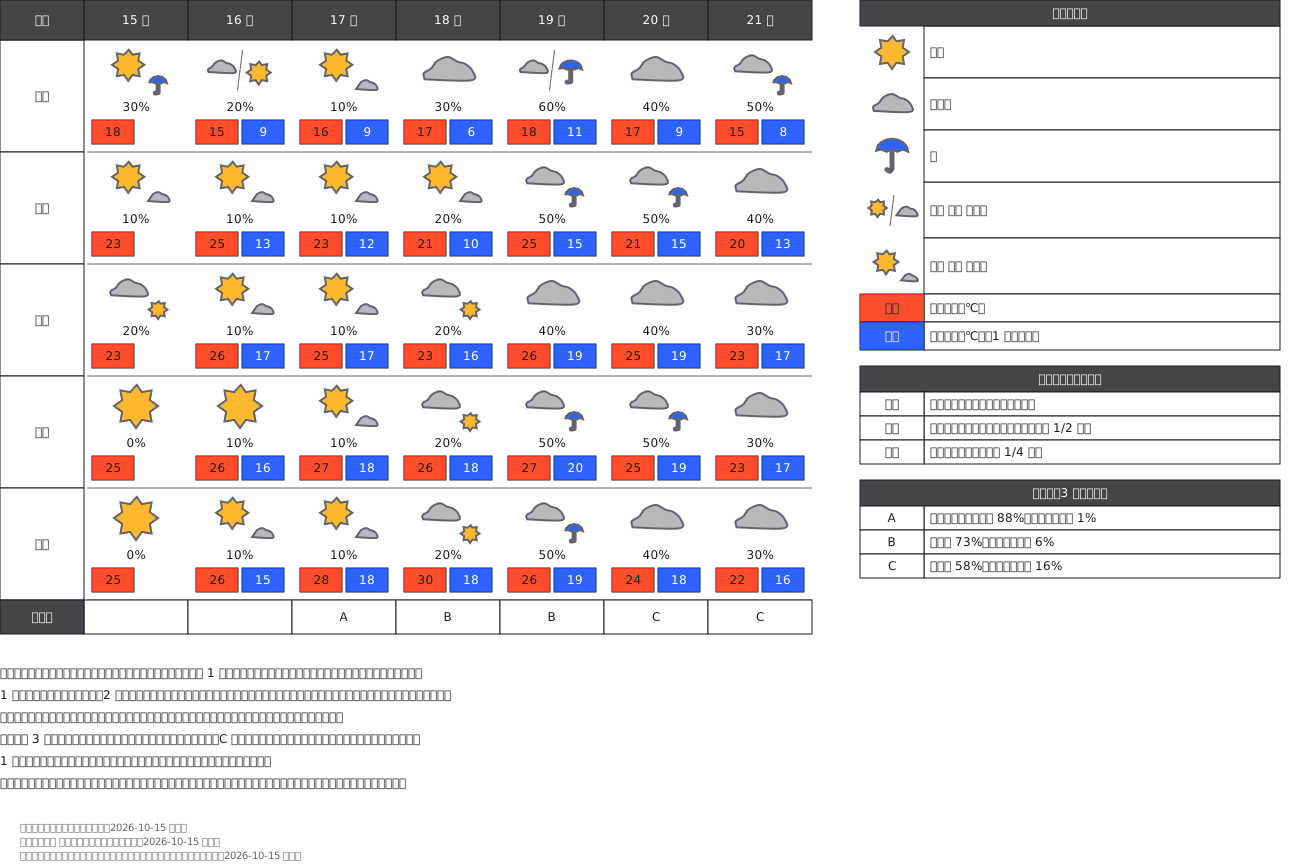 Weekly weather forecast table: 5 cities × 7 days, each cell with a weather mark (sun, cloud, umbrella in the JMA colours), chance of rain, and high/low temperatures, showing how "later" and "at times" combine two marks, plus the A/B/C reliability grade from day 3. Forecast values are fictional.
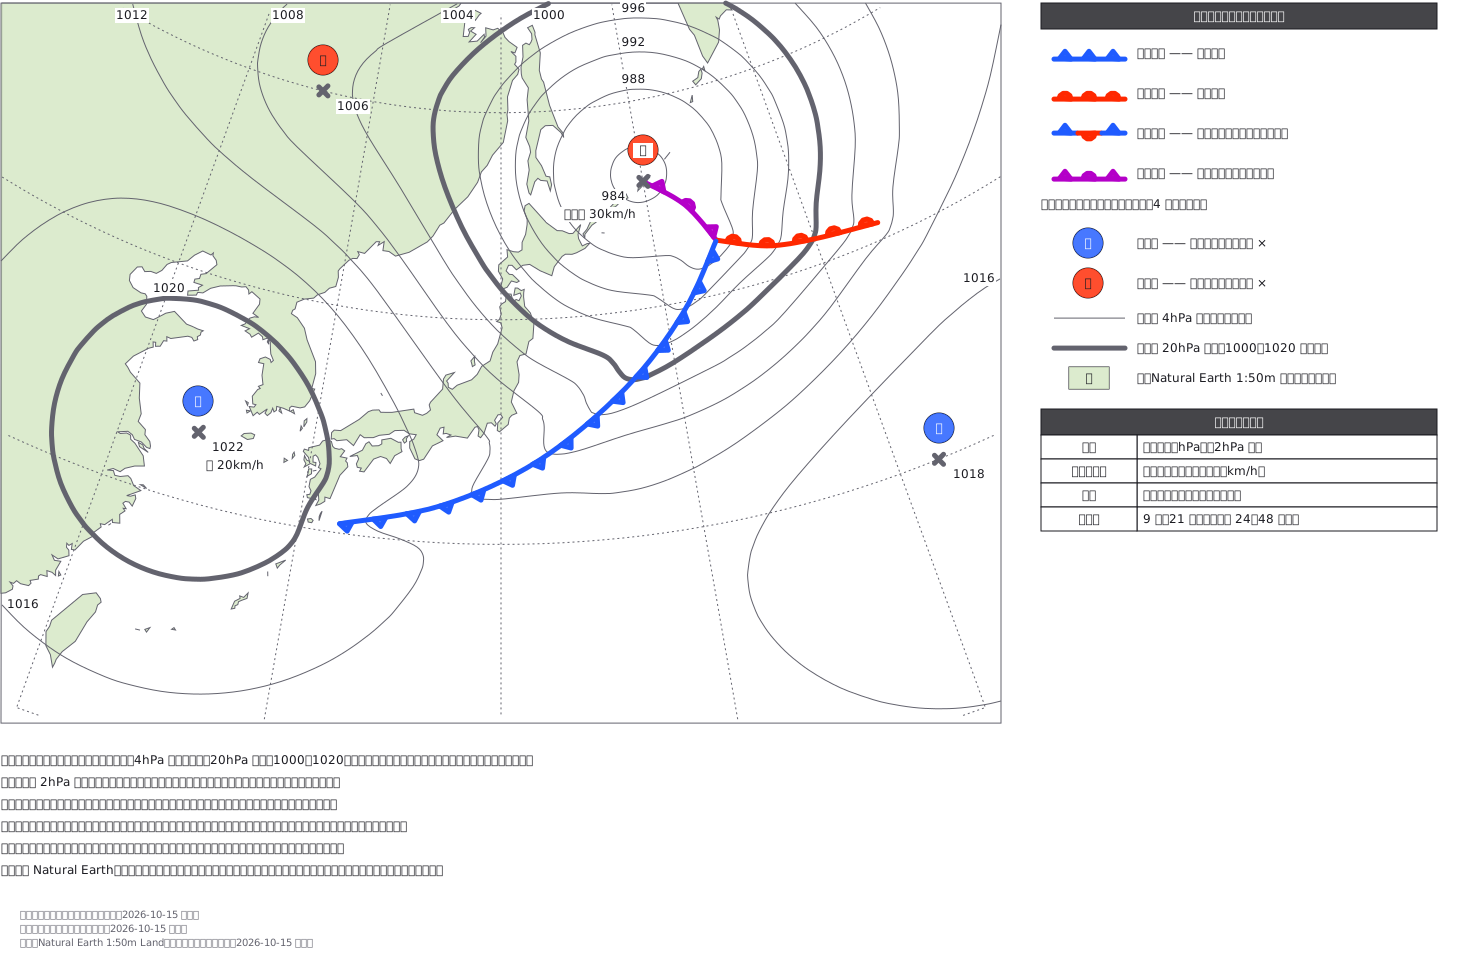 Surface weather chart around Japan (a fictional forecast): coastlines on a polar stereographic base, isobars every 4 hPa traced from a pressure field with 1000 and 1020 hPa drawn thick, a deepening low east of Hokkaido with occluded, warm and cold fronts whose symbols sit on the side the front is moving toward, and the JMA blue H / red L stamps.
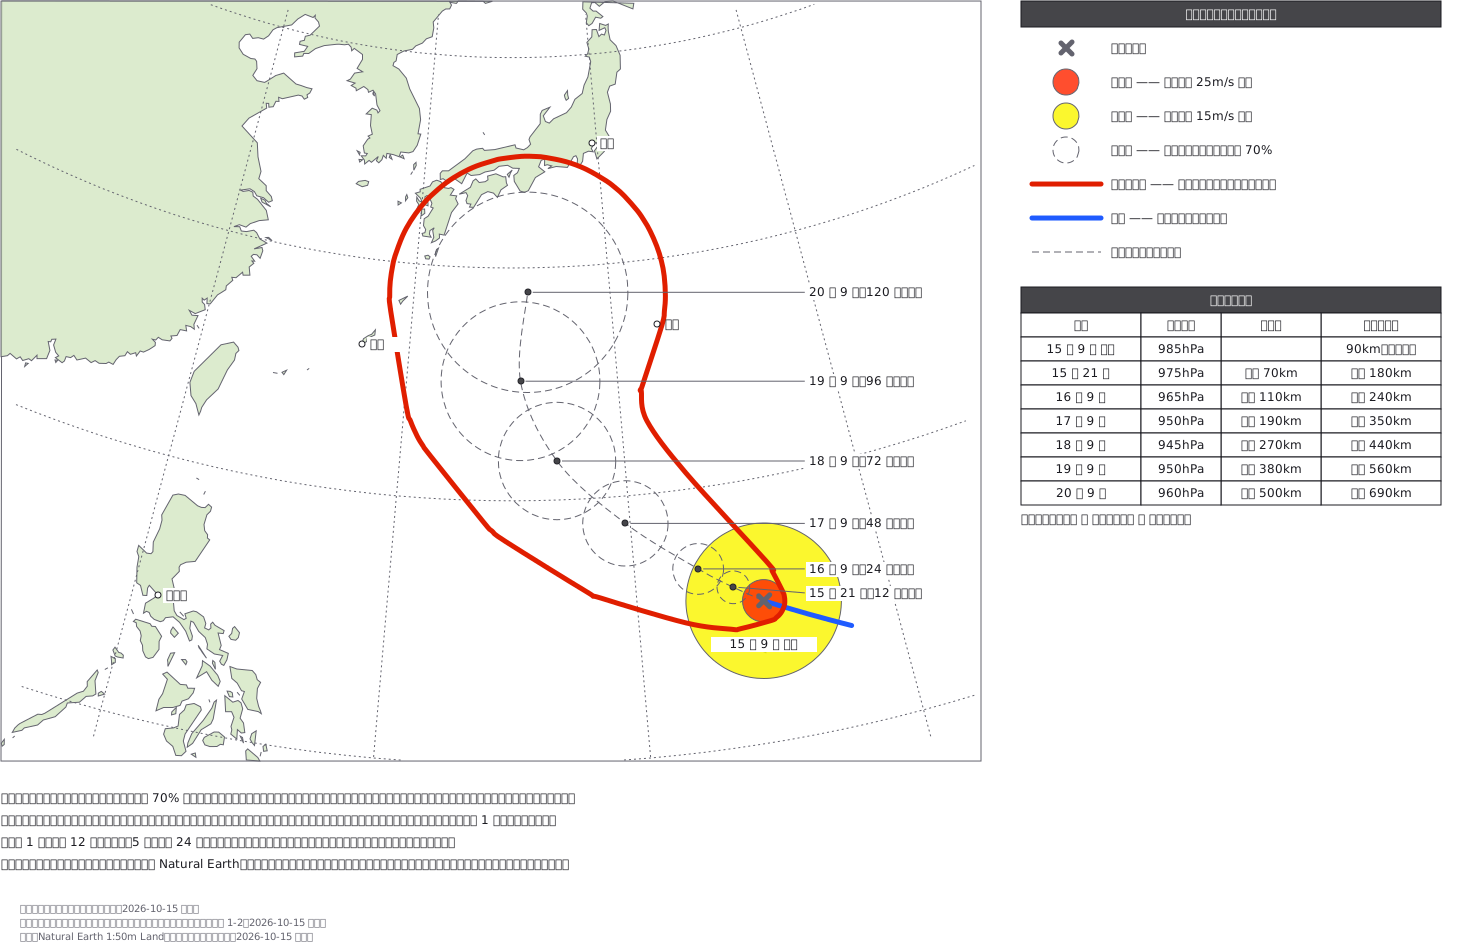 Typhoon track forecast (fictional) over the coastlines of Japan and East Asia: the current centre with its storm (red) and gale (yellow) areas, dashed 70% forecast circles out to 120 hours, and the storm warning area drawn as one red line wrapping every forecast circle widened by the storm radius, as JMA draws it.
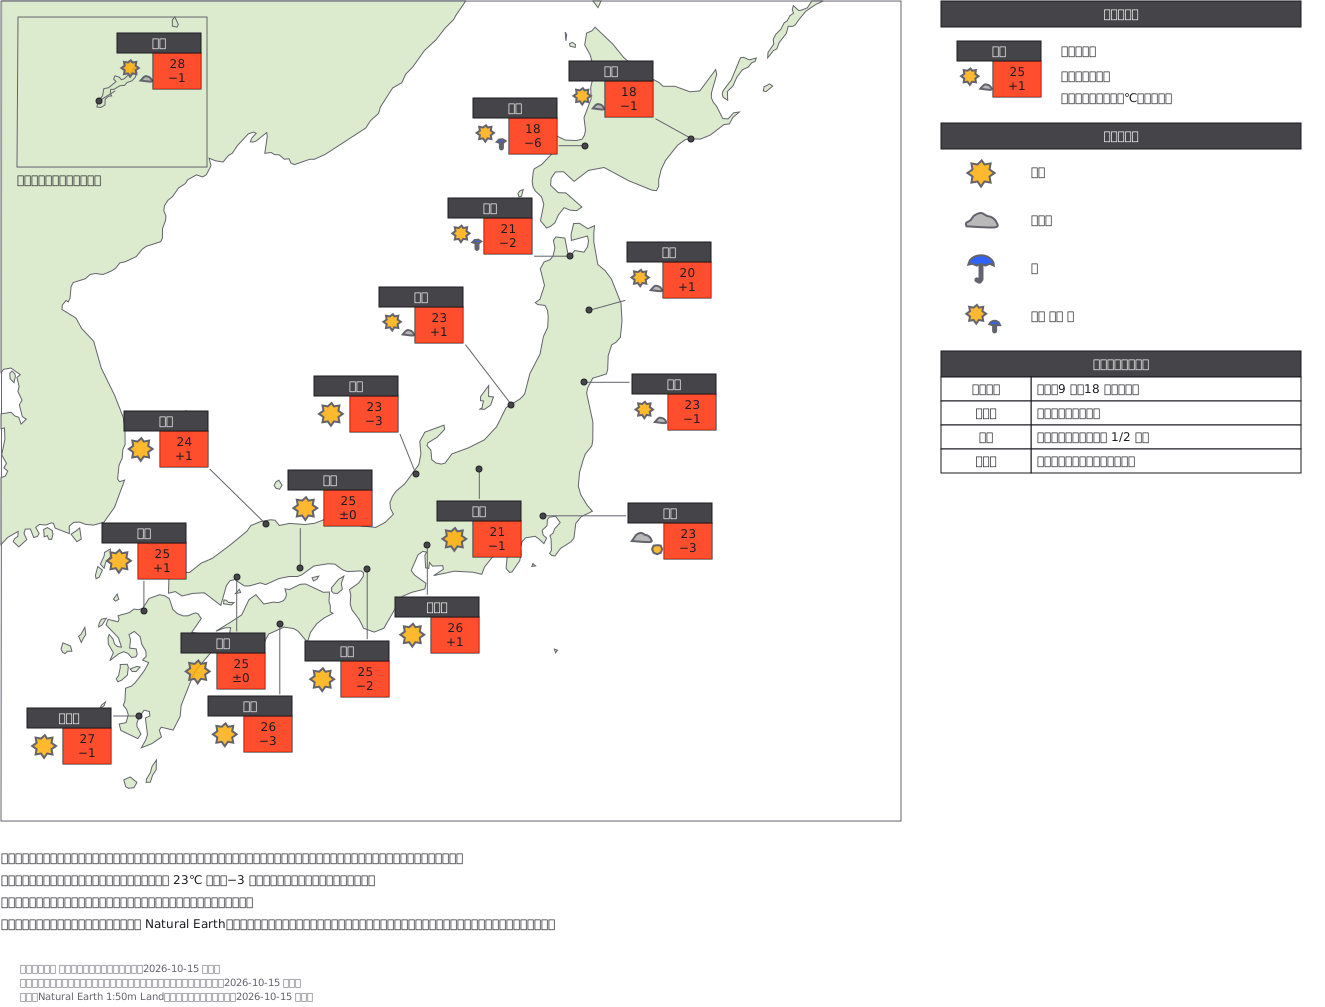 Today's weather by city on a map of Japan (fictional values): a card per city with its weather mark, forecast high and change from yesterday, set beside the city and tied to its true position by a thin leader line, with Okinawa moved into an inset at the same scale.
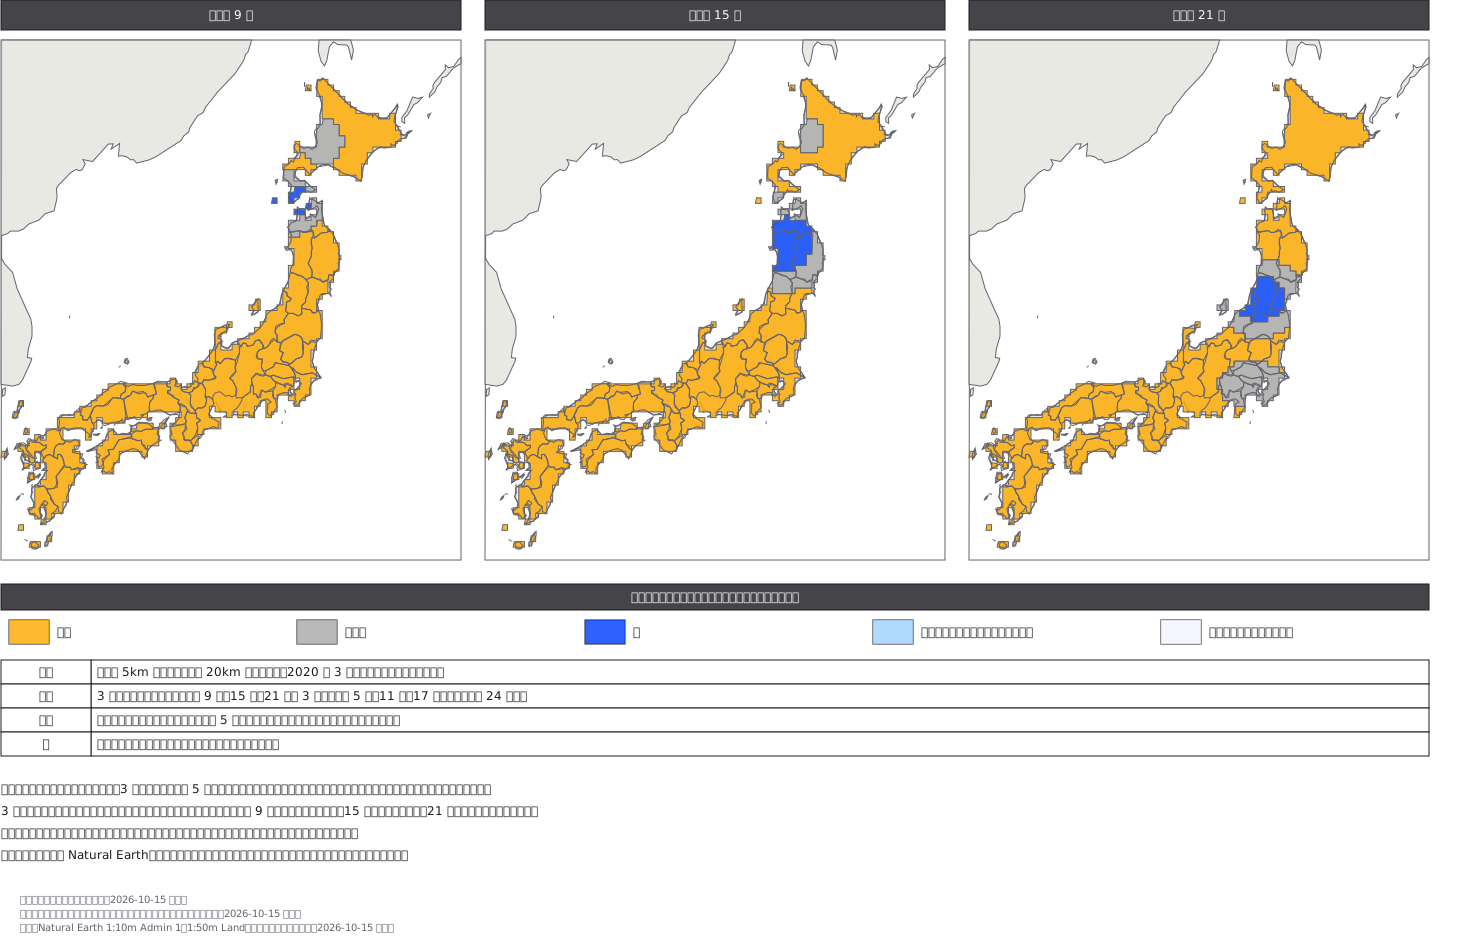 Gridded weather distribution forecast (fictional): Japan divided into 20 km cells, each coloured clear, cloudy or rain in the JMA colours, for 9:00, 15:00 and 21:00 side by side so the rain band can be seen moving south, with prefecture boundaries drawn over the stepped grid.
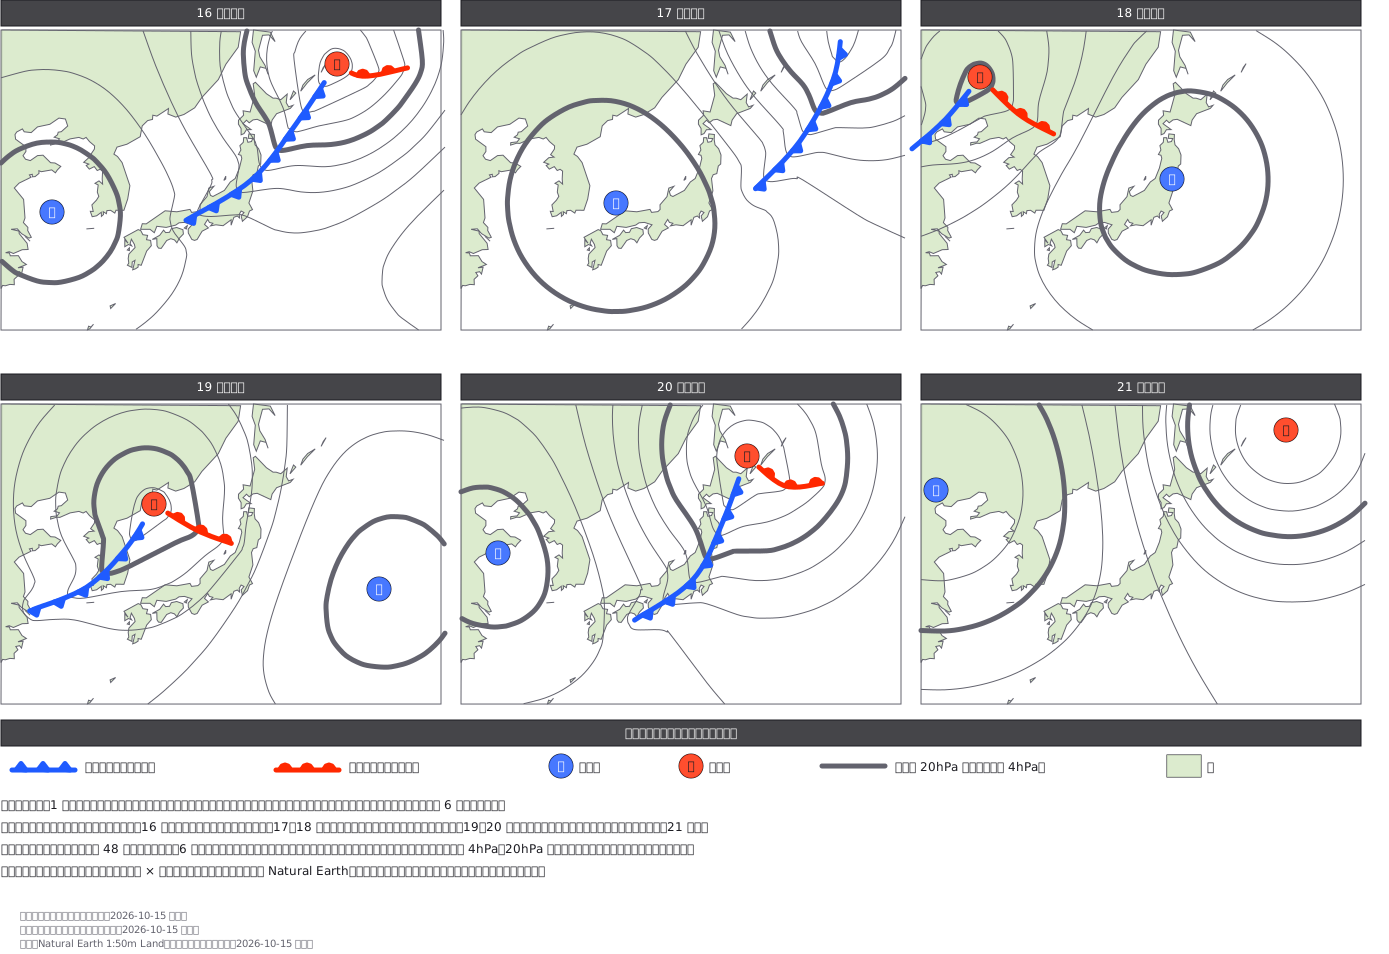 Weekly weather charts (fictional): six daily forecast surface charts around Japan side by side, with isobars, blue H and red L stamps and fronts drawn to JMA conventions, showing highs and lows passing from west to east over the week.
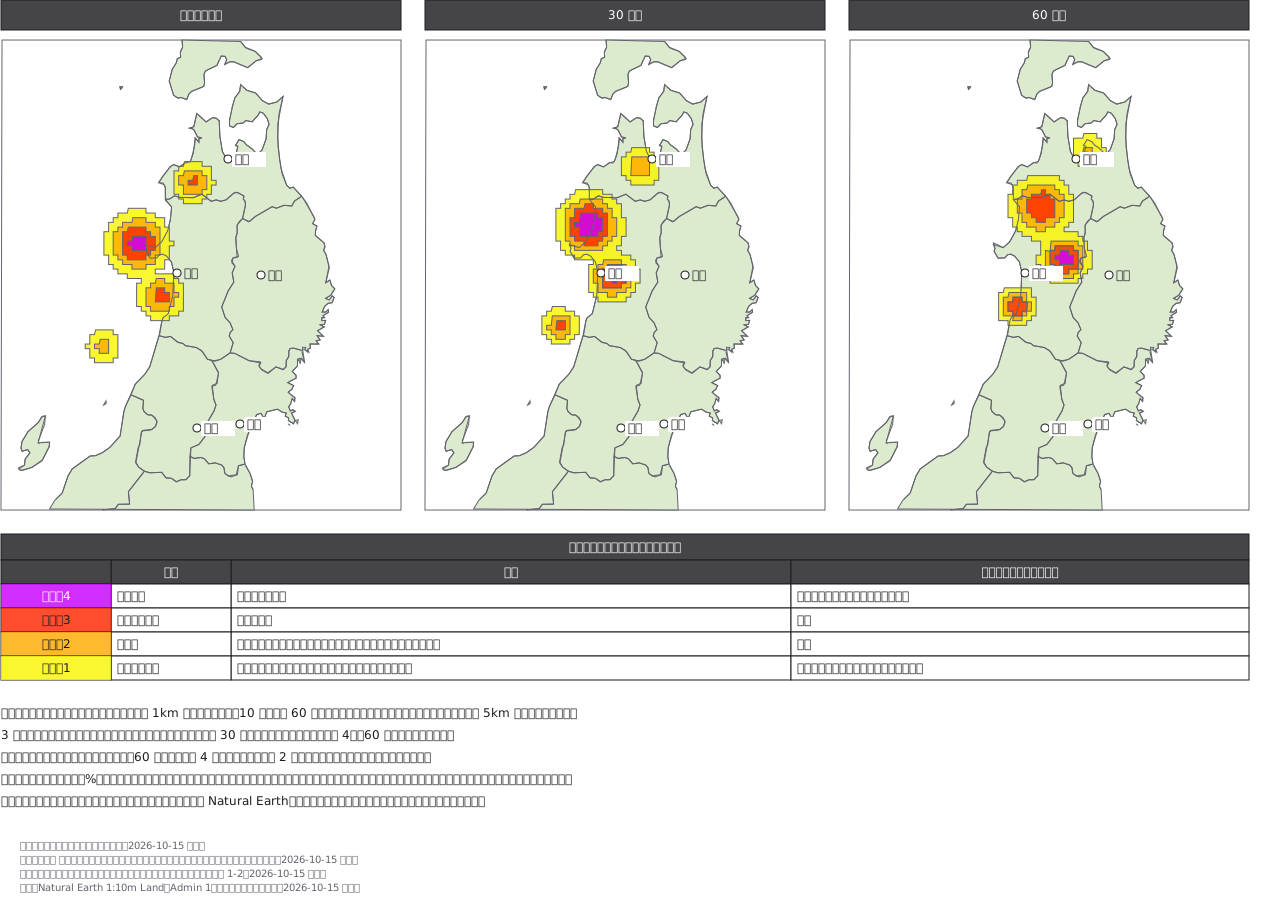 Lightning nowcast for northern Japan (fictional): lightning activity levels 1–4 painted on a 5 km grid in the JMA colours, for the current analysis and 30 and 60 minutes ahead, with the JMA meaning of each level and the action it calls for.
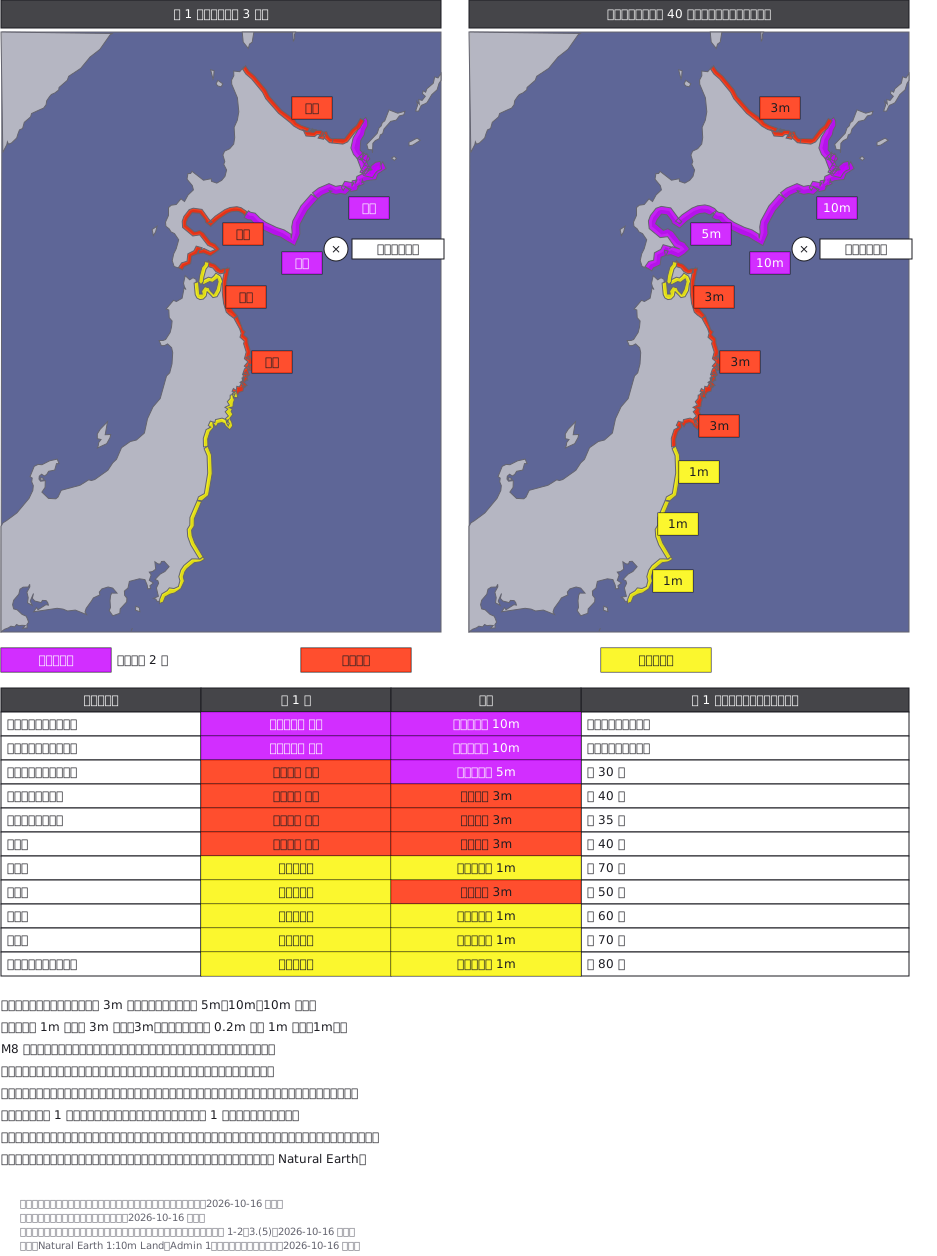 Tsunami warnings and advisories (fictional): the coastline itself is coloured, purple doubled in width for a major tsunami warning, red for a warning and yellow for an advisory, on the dark blue sea JMA uses. The first bulletin after an M8+ quake says only "huge" or "high"; the update replaces them with 10 m, 5 m, 3 m and 1 m and raises two areas.
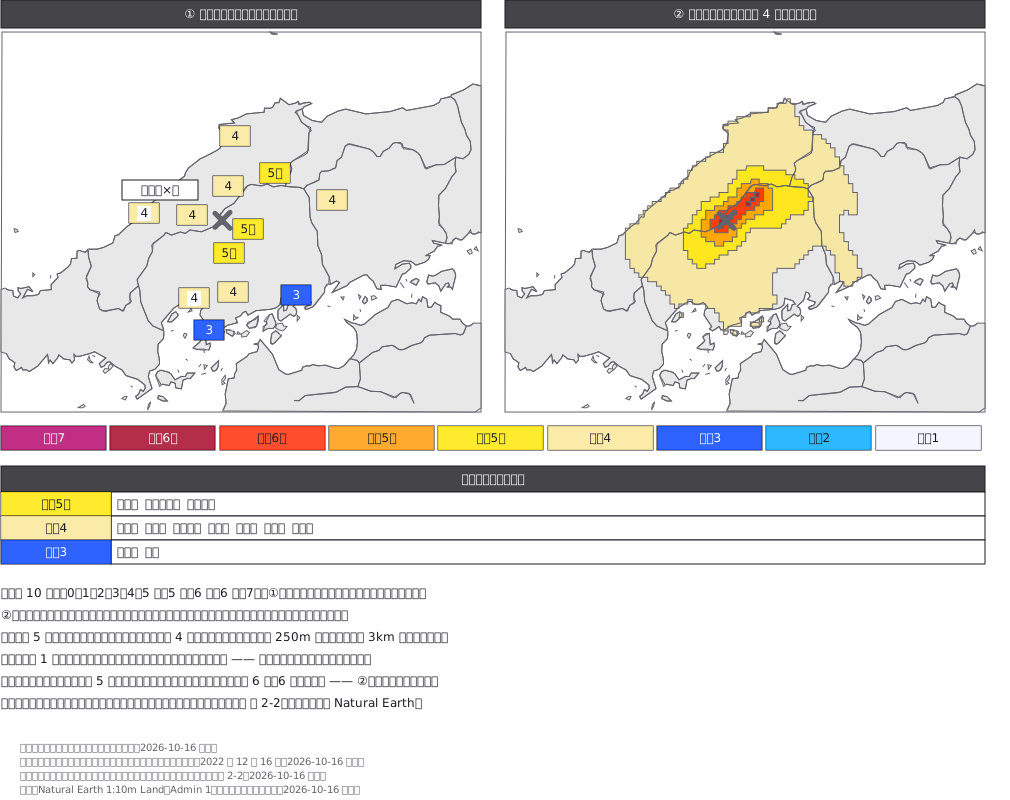 Seismic intensity two ways for a fictional inland quake in western Japan: the shindo measured at each station as coloured tags, and JMA's estimated intensity map painting shindo 4 and above on a grid. The strongest station reading is 5-lower, yet the grid estimates 6-upper right above the fault where no seismometer stands.
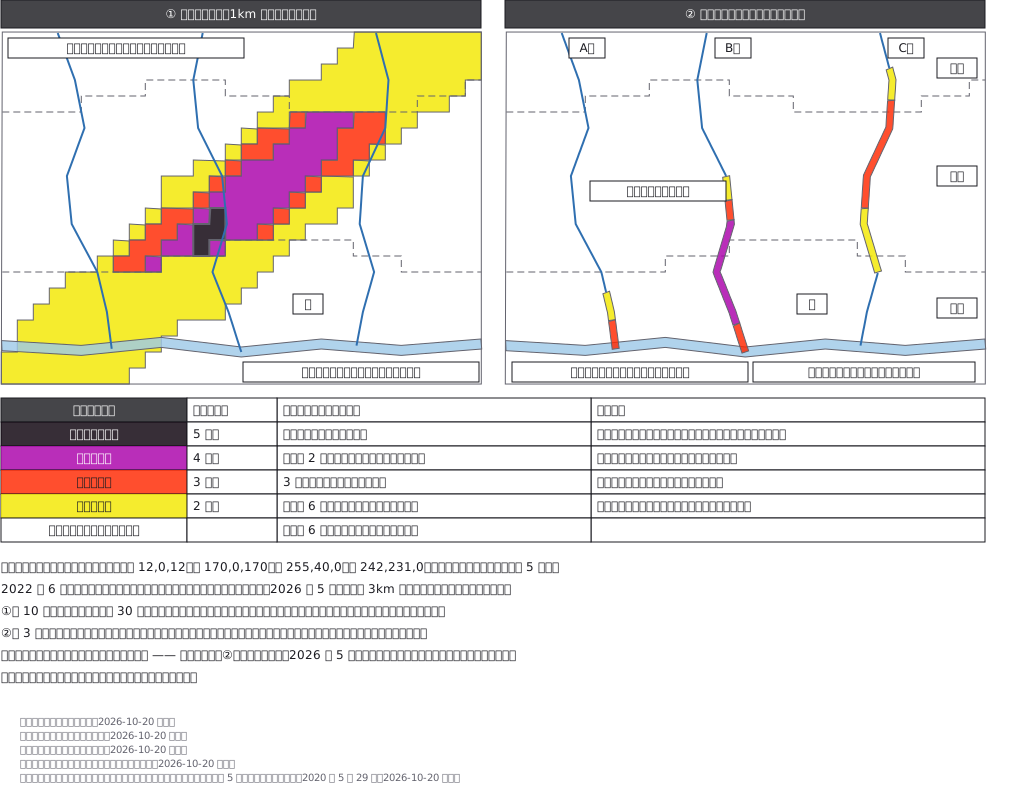 JMA's KiKiKuru risk maps for a fictional town: the landslide map paints a 1 km mesh yellow, red, purple and black along a band of heavy rain, but on the plain and in the uninhabited mountains it stops at yellow: no warning criteria are set there. The flood map colours the small rivers, purple and red moving downstream; the large river gets none. Evacuate at purple; never wait for black.