Disaster and emergency
Weather distribution forecast (20 km grid, three times side by side; fictional)
Gridded weather distribution forecast (fictional): Japan divided into 20 km cells, each coloured clear, cloudy or rain in the JMA colours, for 9:00, 15:00 and 21:00 side by side so the rain band can be seen moving south, with prefecture boundaries drawn over the stepped grid.
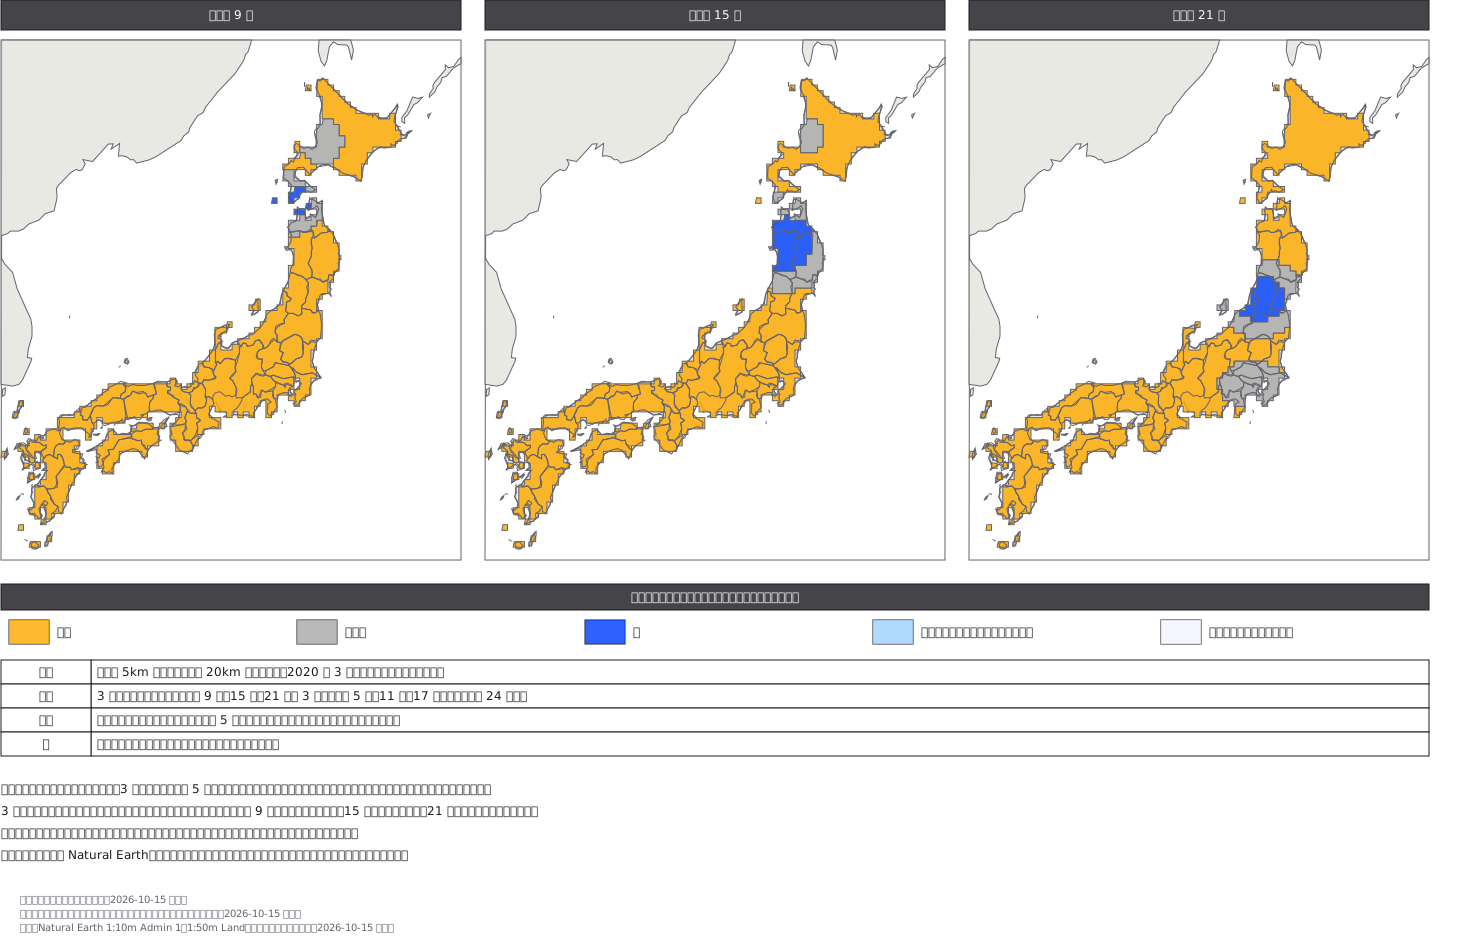
This drawing comes from one YAML file. No shape was moved by hand.
Notes in the source (in Japanese)
天気分布予報は、天気を格子で塗った地図。 地点の予報より細かく「何時に、どこで降るか」が読める。
決まり(気象庁「天気分布予報」・配色指針)——- 全国を 5km 四方の格子に分け、3 時間ごと、明日 24 時まで。毎日 5 時・11 時・17 時に発表- 天気は 5 区分:晴れ(255,170,0)・くもり(170 の灰)・雨(0,65,255)・雨または雪(160,210,255)・雪(242,242,255)
この図は格子を 20km に粗くした(2020 年 3 月 18 日までの気象庁と同じ大きさ)。5km では 1 枚 1 万マスを超え、見本として重すぎる。格子は中心が日本の都道府県の中にあるものだけを塗り、同じ天気のマスをつないで 1 つの輪にした(境は格子なりの階段)。塗る順は 晴れ → くもり → 雨。輪の穴が海なら地の色で抜いた。描いた順に塗ったときの色が全マスで正しいことを確かめてある(色違い 0)。その上に都道府県の線(海岸線を兼ねる)を引いた。
3 枚を並べたのは、時間で移るのが分布予報の読みどころだから(この図では雨の範囲が北から南へ移る)。北方領土は陸として描き、色は塗らない。沖縄・小笠原は枠の外。天気は架空。陸と都道府県の線は Natural Earth(パブリックドメイン)。テレビ局の様式は写していない。
Source (YAML)
examples/gallery/394-天気分布予報-格子と3時刻.zumen.yaml
More in this field
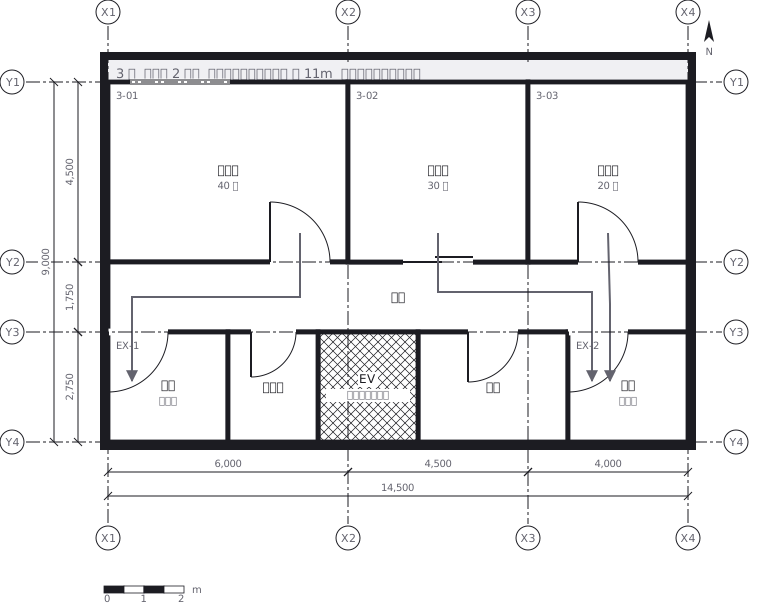 Escape routes on a third floor: two ways out of every room to a staircase, with the travel distance and the fire doors and extinguishers along the way
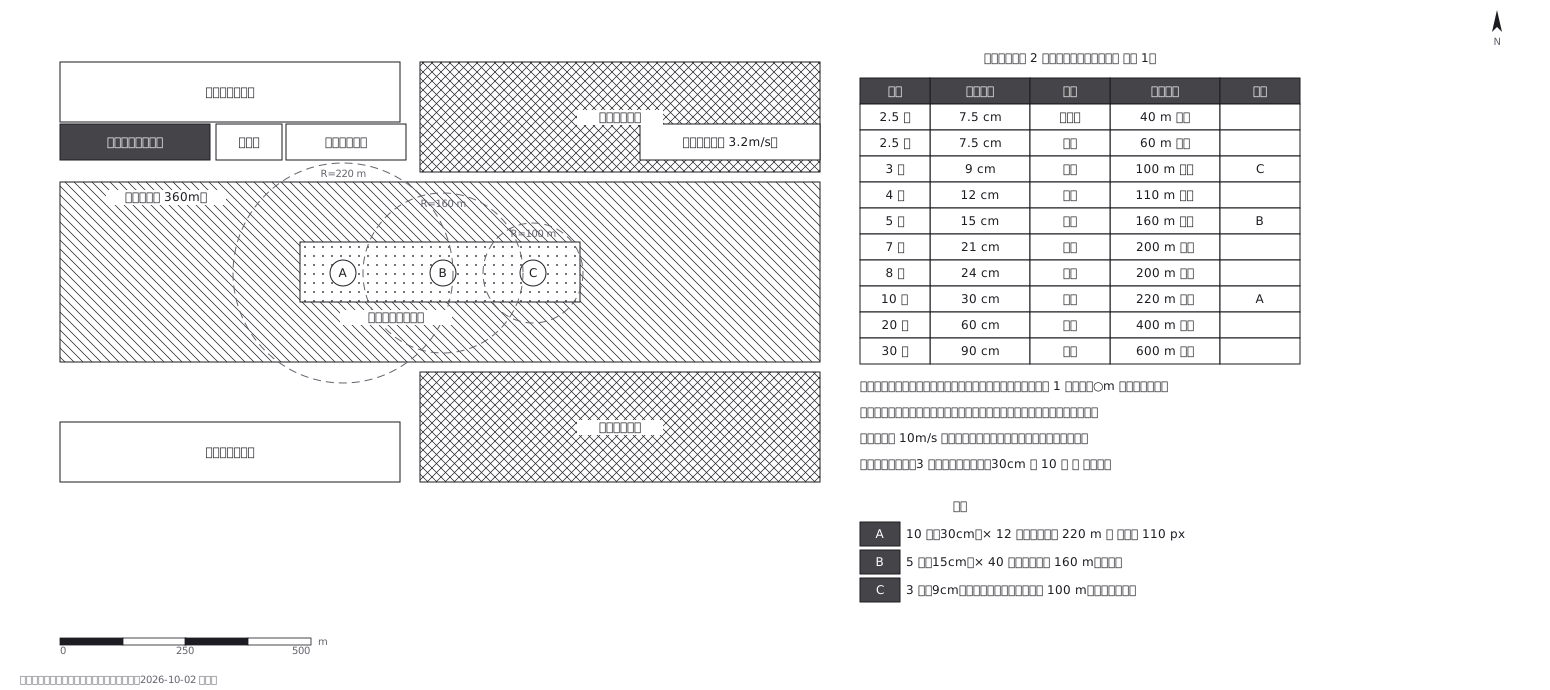 Fireworks safety distances, a circle per shell size
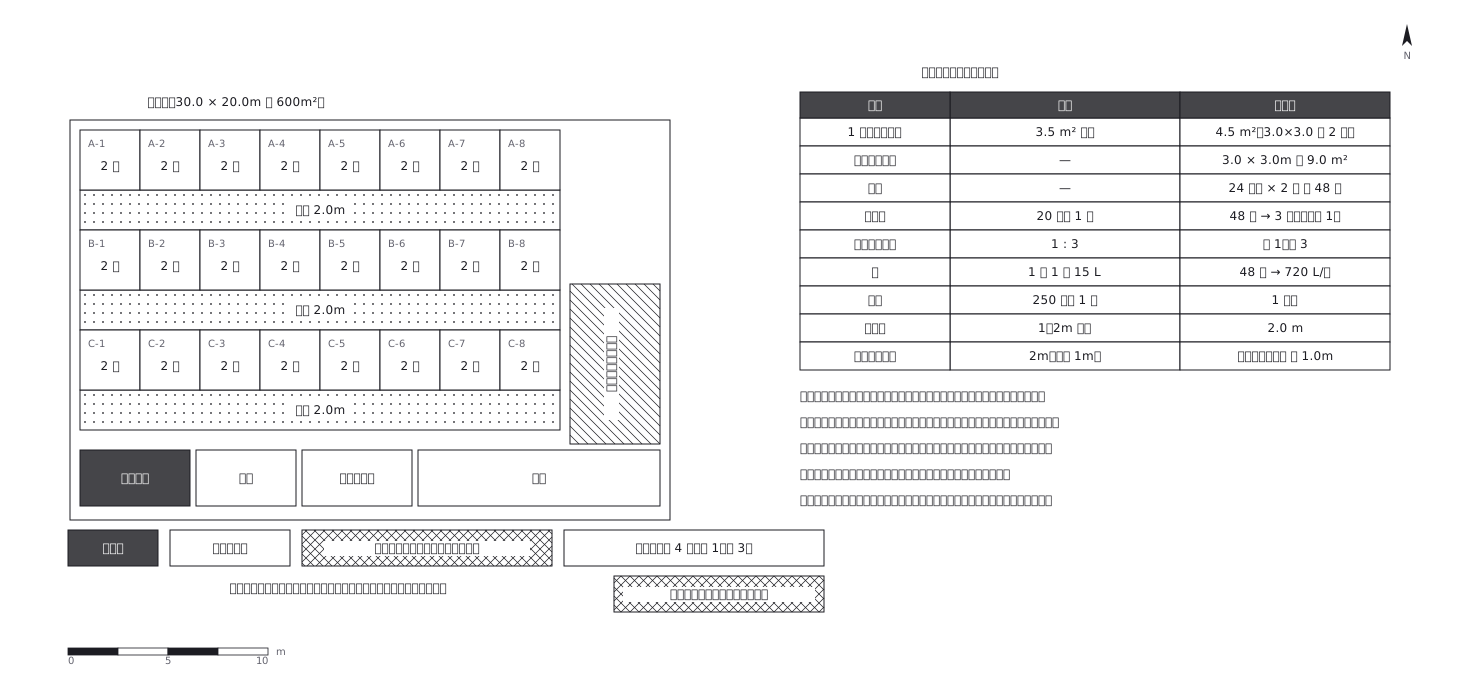 Shelter layout: 3.5 sq m a person, and how many toilets
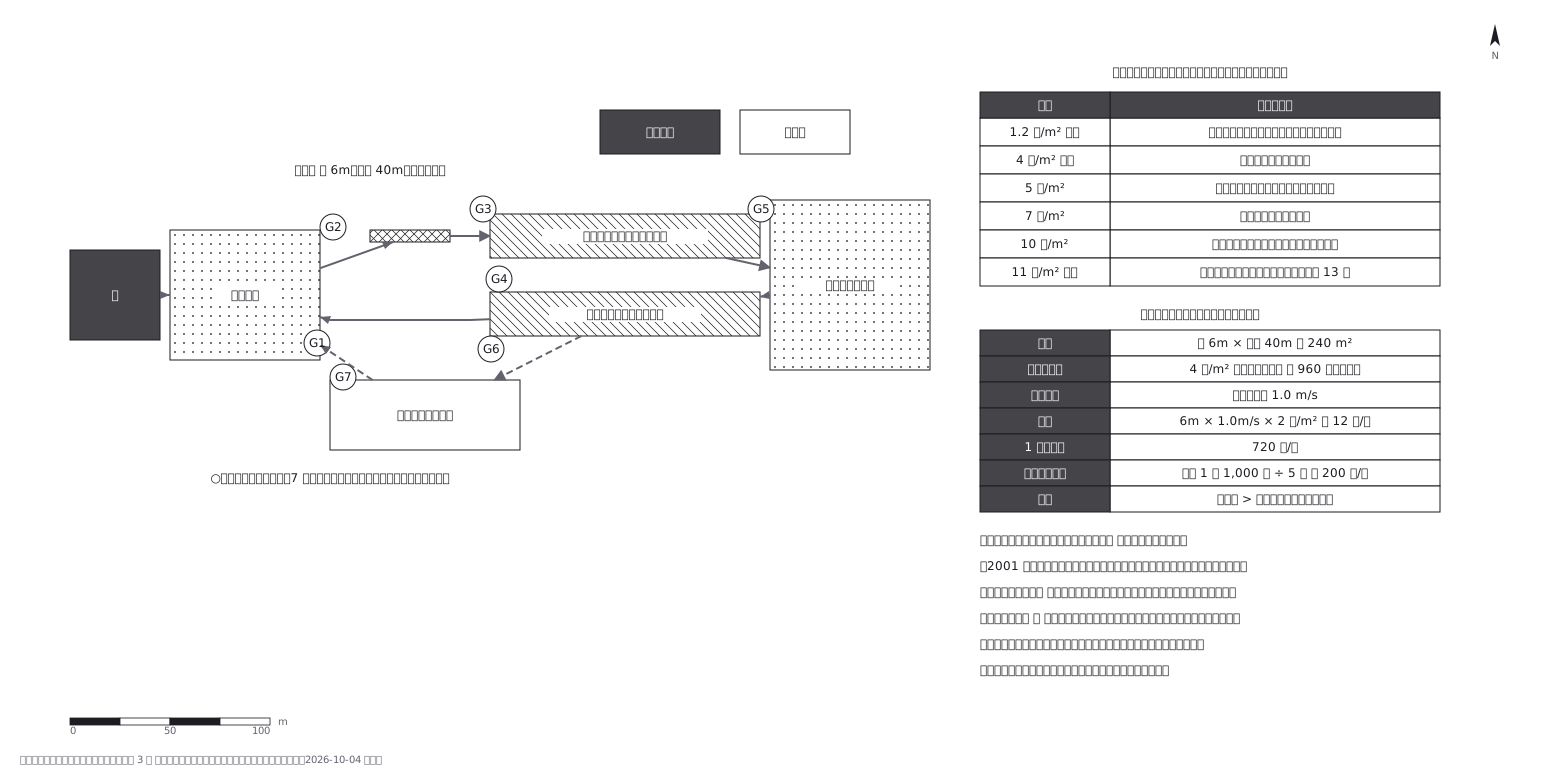 Crowd plan: how many can flow out against how many come in
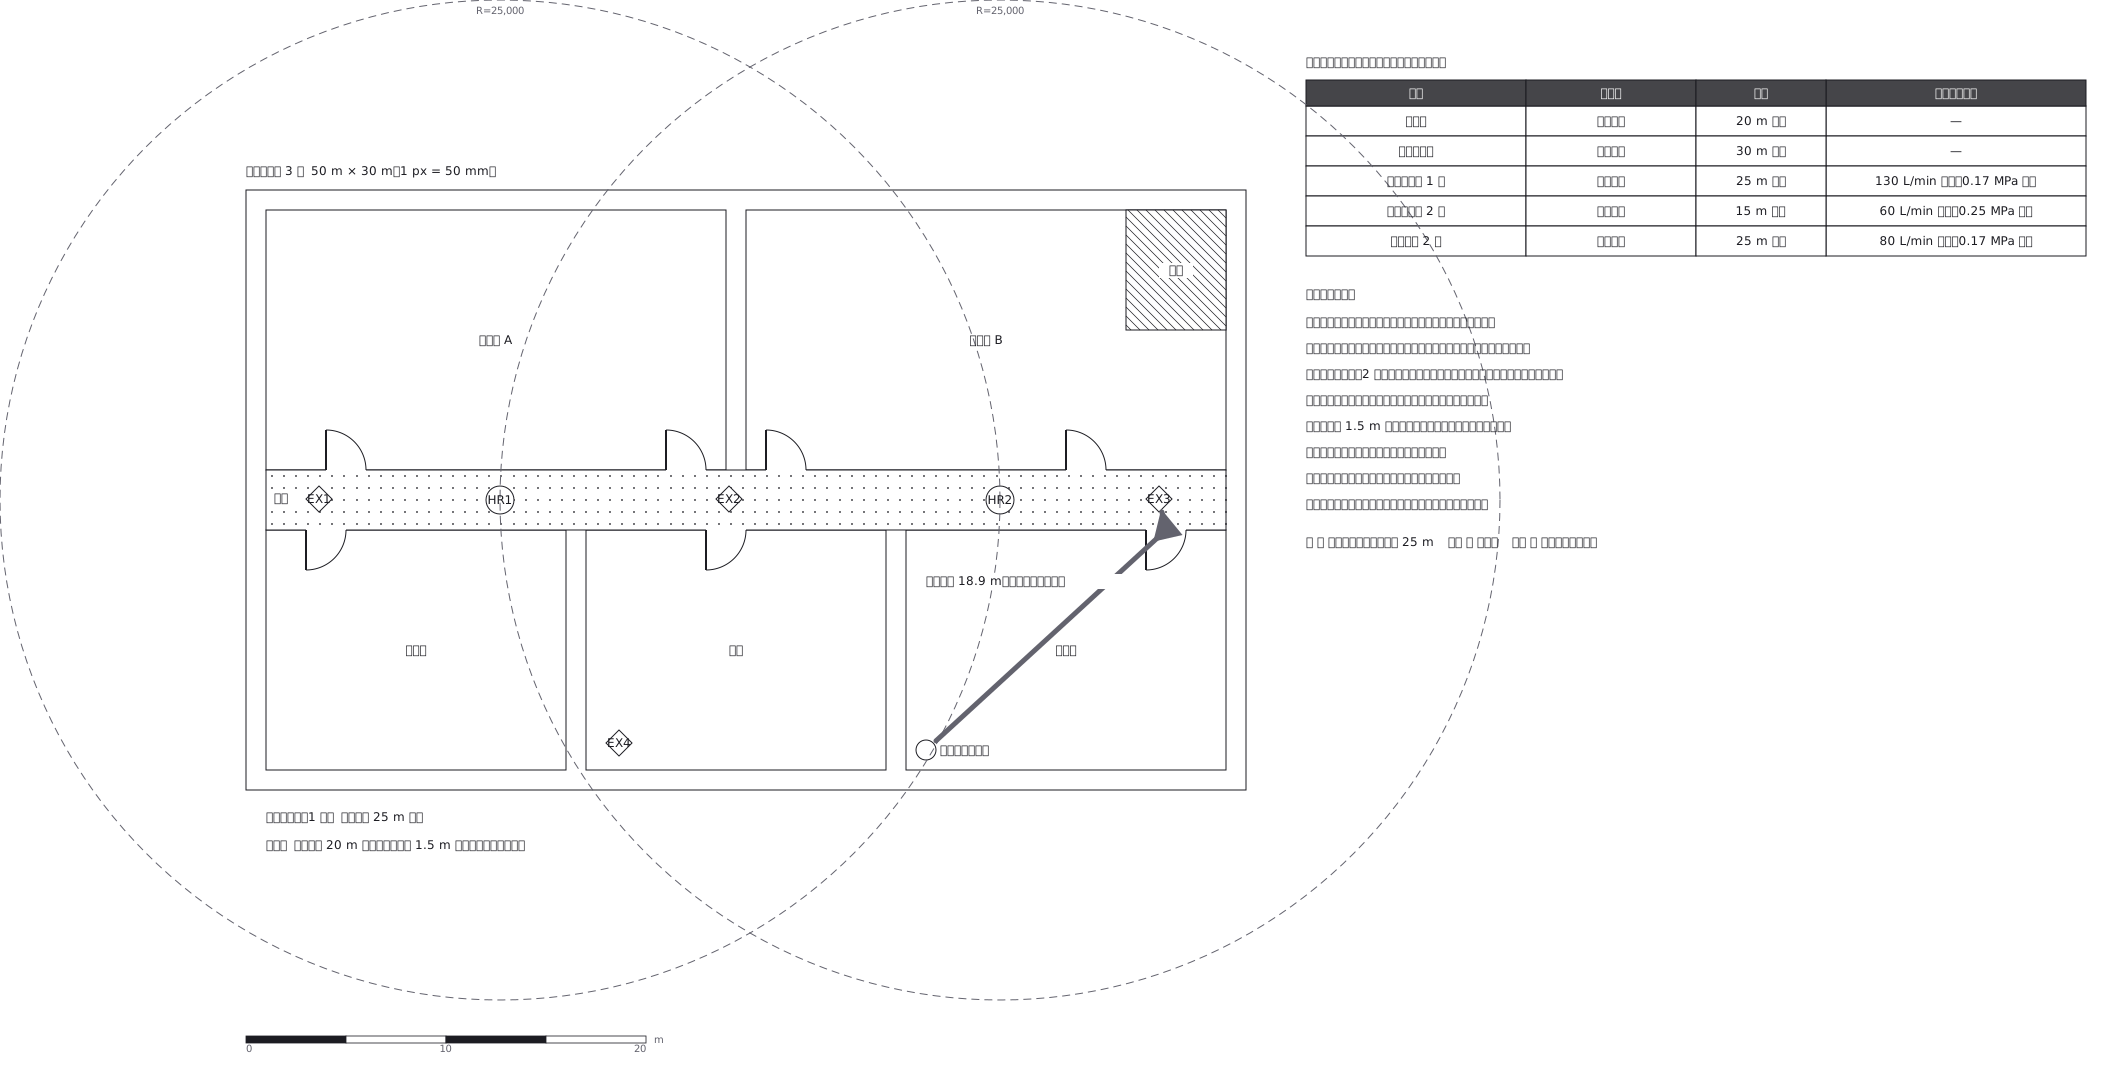 Extinguishers and hose reels, measured two different ways
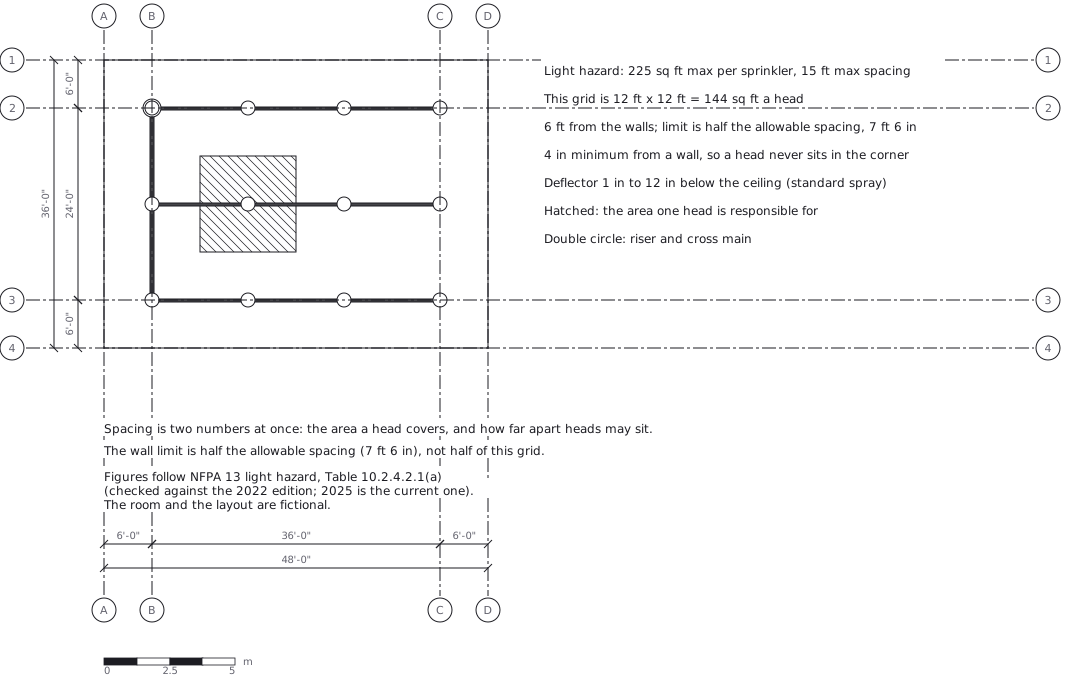 Sprinkler layout: area per head and spacing, decided together
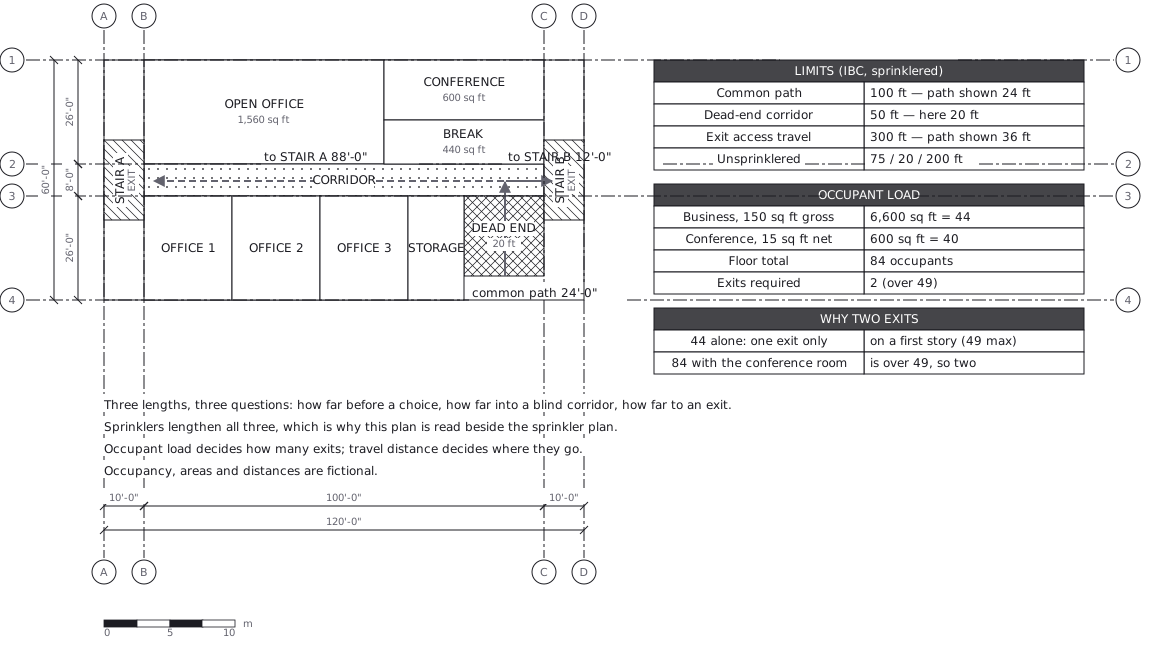 Egress plan: three lengths answering three questions
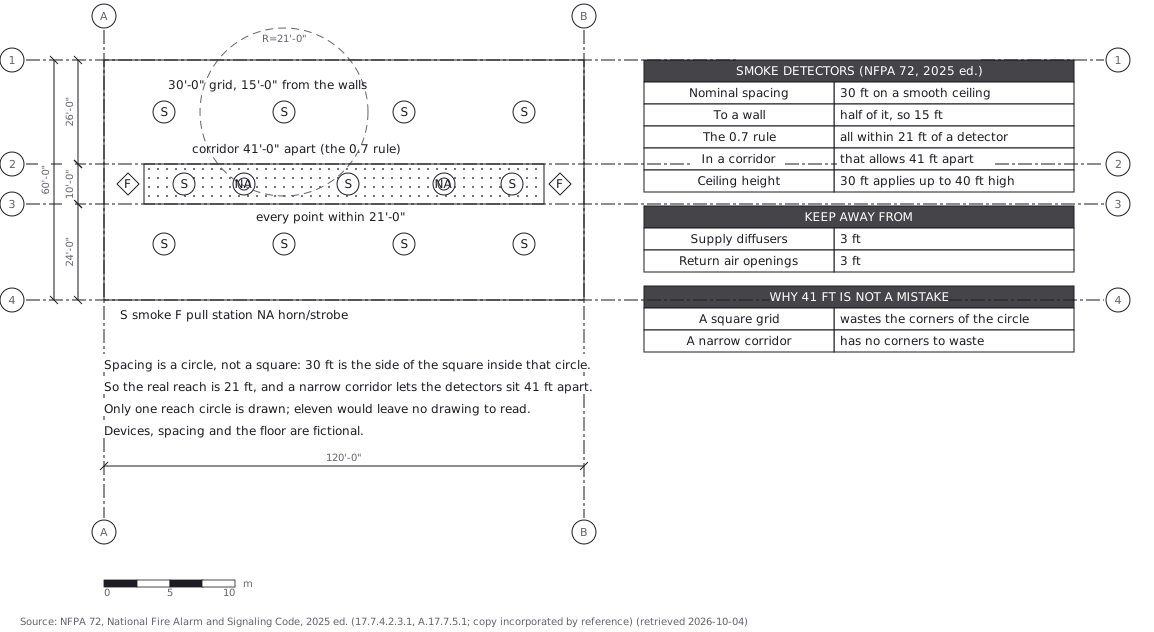 Fire alarm devices: spacing is a circle, not a square