Disaster and emergency
Weather and forecast maximum temperature by city (cards on a map with change from the day before; fictional)
Today's weather by city on a map of Japan (fictional values): a card per city with its weather mark, forecast high and change from yesterday, set beside the city and tied to its true position by a thin leader line, with Okinawa moved into an inset at the same scale.
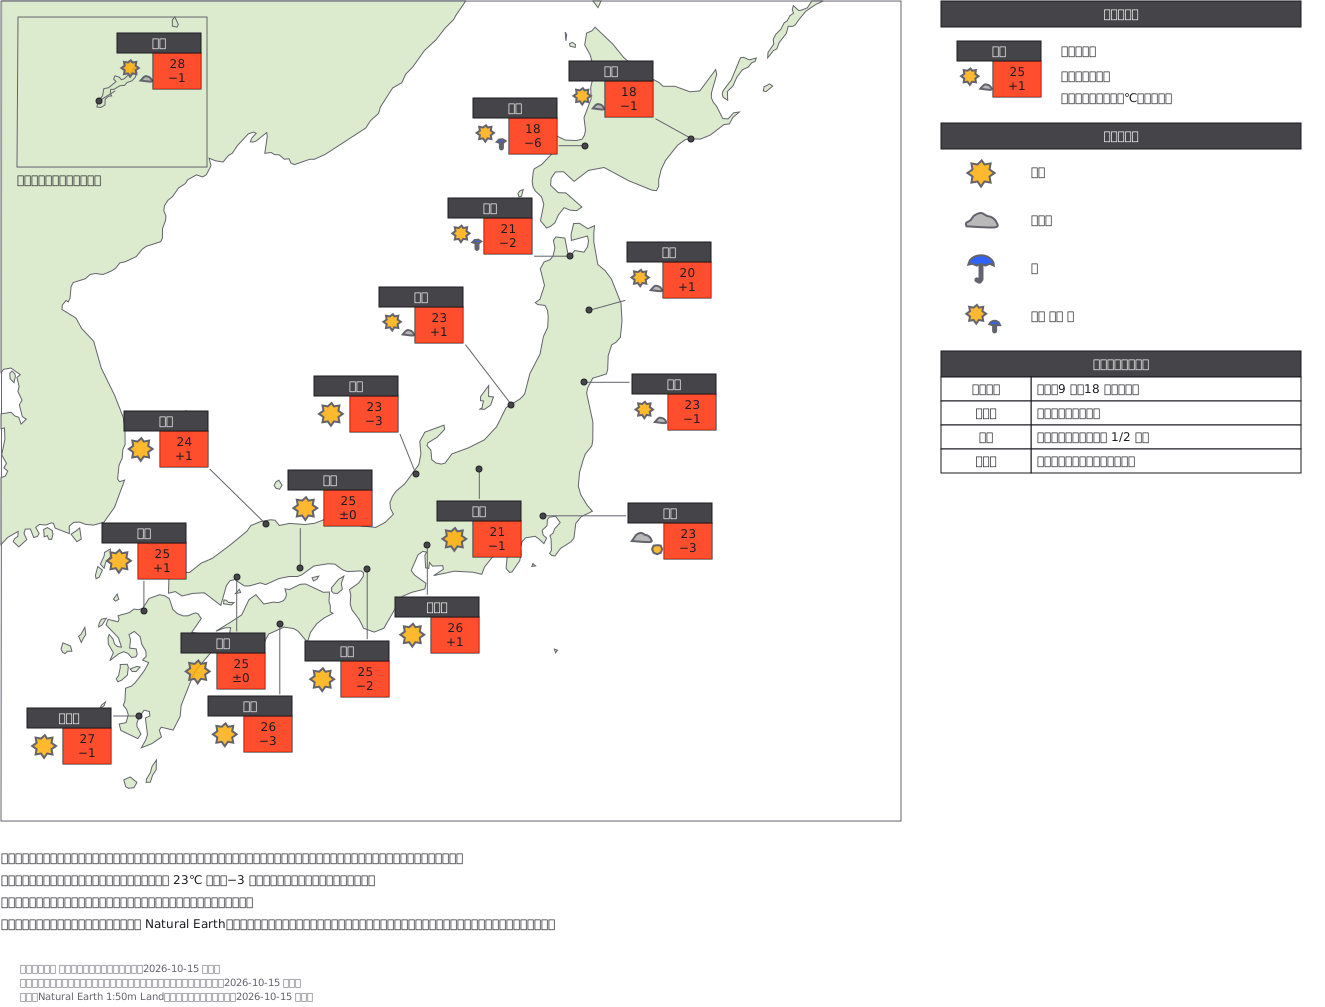
This drawing comes from one YAML file. No shape was moved by hand.
Notes in the source (in Japanese)
地図の上の札は、地点ごとの 1 行の表。 名前・天気マーク・予想最高気温・前日差を、その地点のそばに置く。
札は地点そのものに重ねず、そばへずらして細い線で本当の位置(点)とつなぐ ——札を地点の上に置くと、密な所(近畿・中国)で札どうしが重なる。テレビの図は札をおおよその位置に置くだけのことが多い。沖縄は本土から離れているので、左上の枠へずらして同じ縮尺で描いた(枠でずらしたことを書く)。
前日差は「きのうの最高との差」。同じ 23℃ でも −3 なら涼しくなった日と読める。最高気温は赤の札(数字は染めない)。天気マークは見本 390 と同じ形と配色(気象庁の配色指針)。
札の置き場所は、海岸線が札の文字の下を通らないところを探して決めた。線の上の文字には読めるように地の色の下敷きが付き、赤い札の中に白い四角が出るため。地点の位置は実在の都市の経緯度。天気・気温・前日差は架空。陸は Natural Earth 1:50m(パブリックドメイン)。国境は描いていない。テレビ局の様式は写していない。
Source (YAML)
examples/gallery/393-地点の天気と予想最高気温-地図に札.zumen.yaml
More in this field
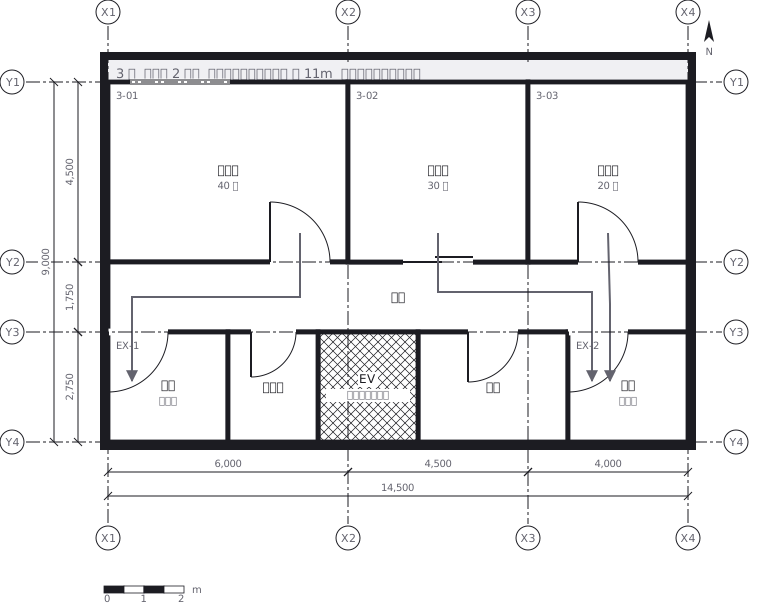 Escape routes on a third floor: two ways out of every room to a staircase, with the travel distance and the fire doors and extinguishers along the way
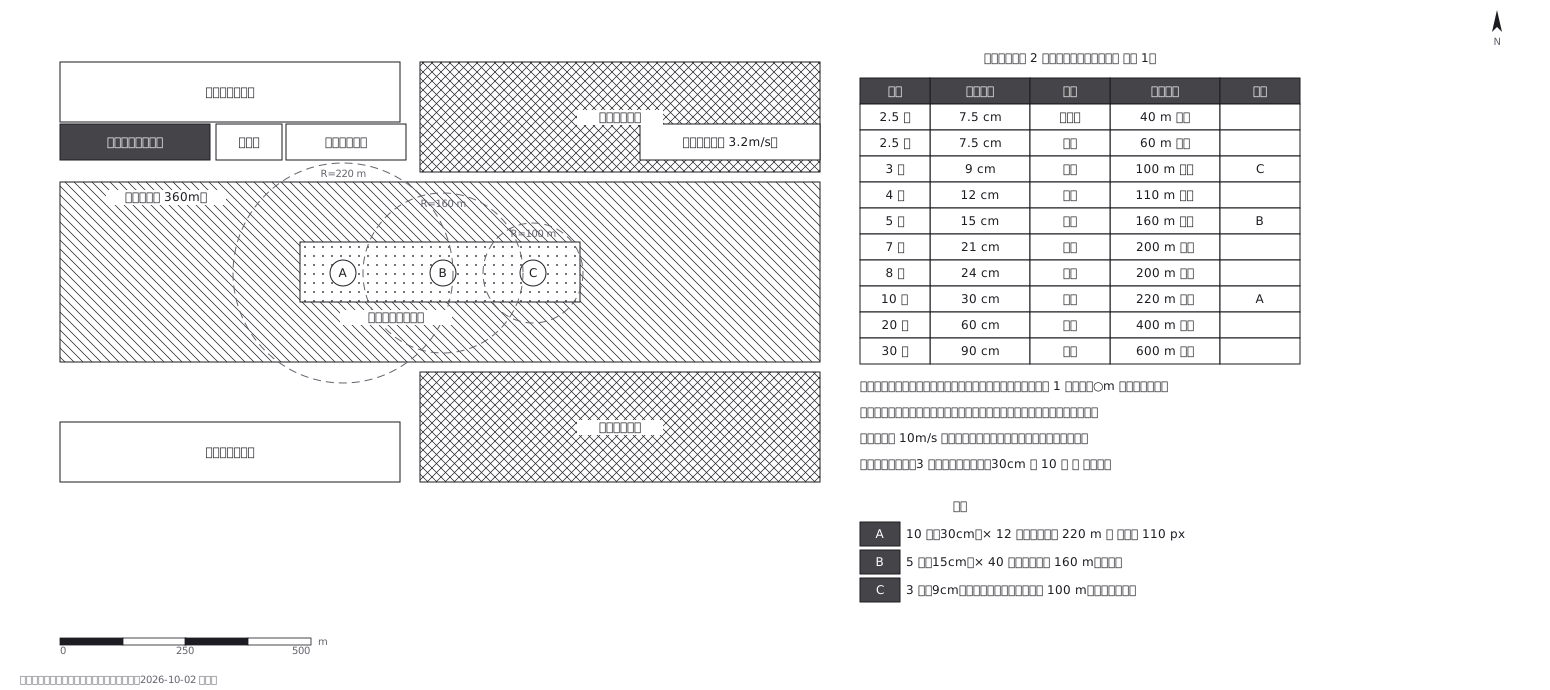 Fireworks safety distances, a circle per shell size
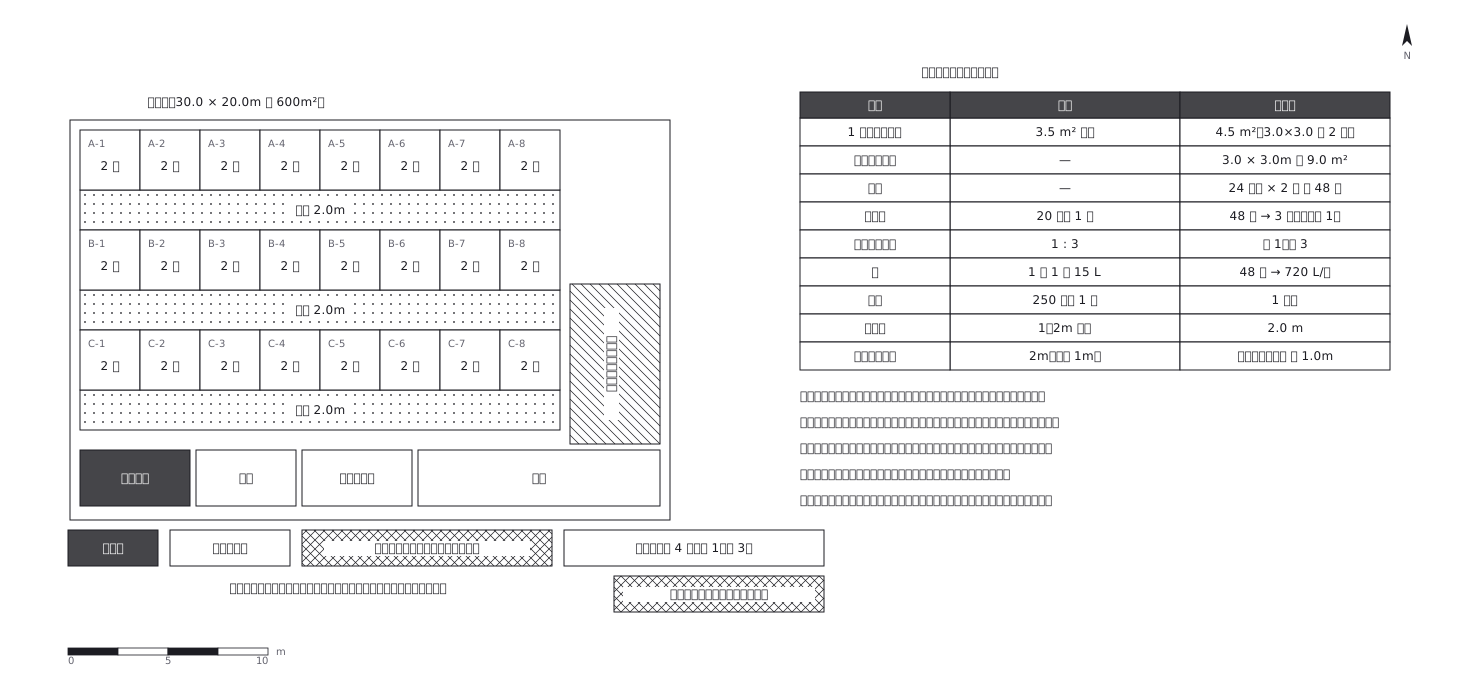 Shelter layout: 3.5 sq m a person, and how many toilets
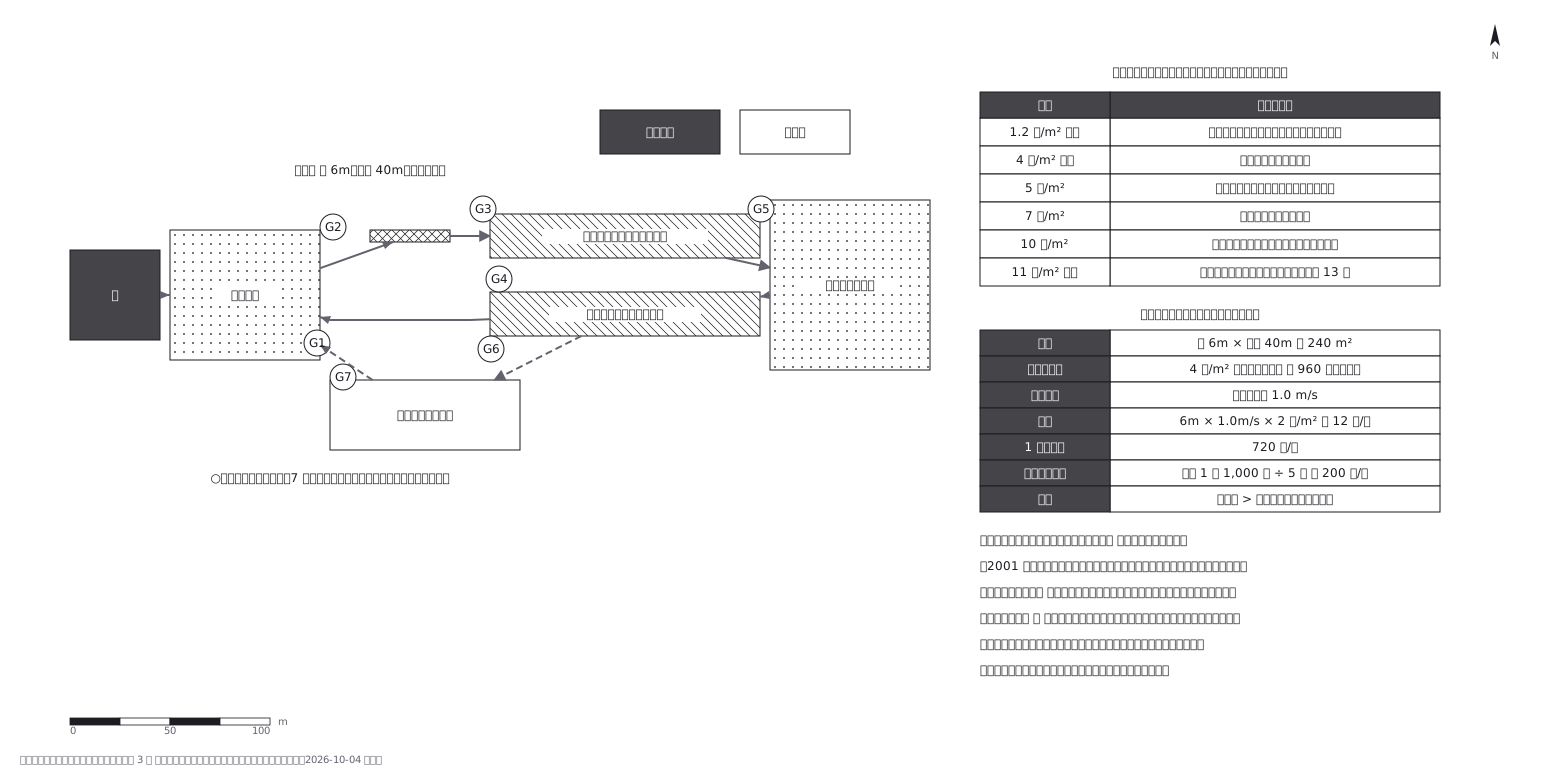 Crowd plan: how many can flow out against how many come in
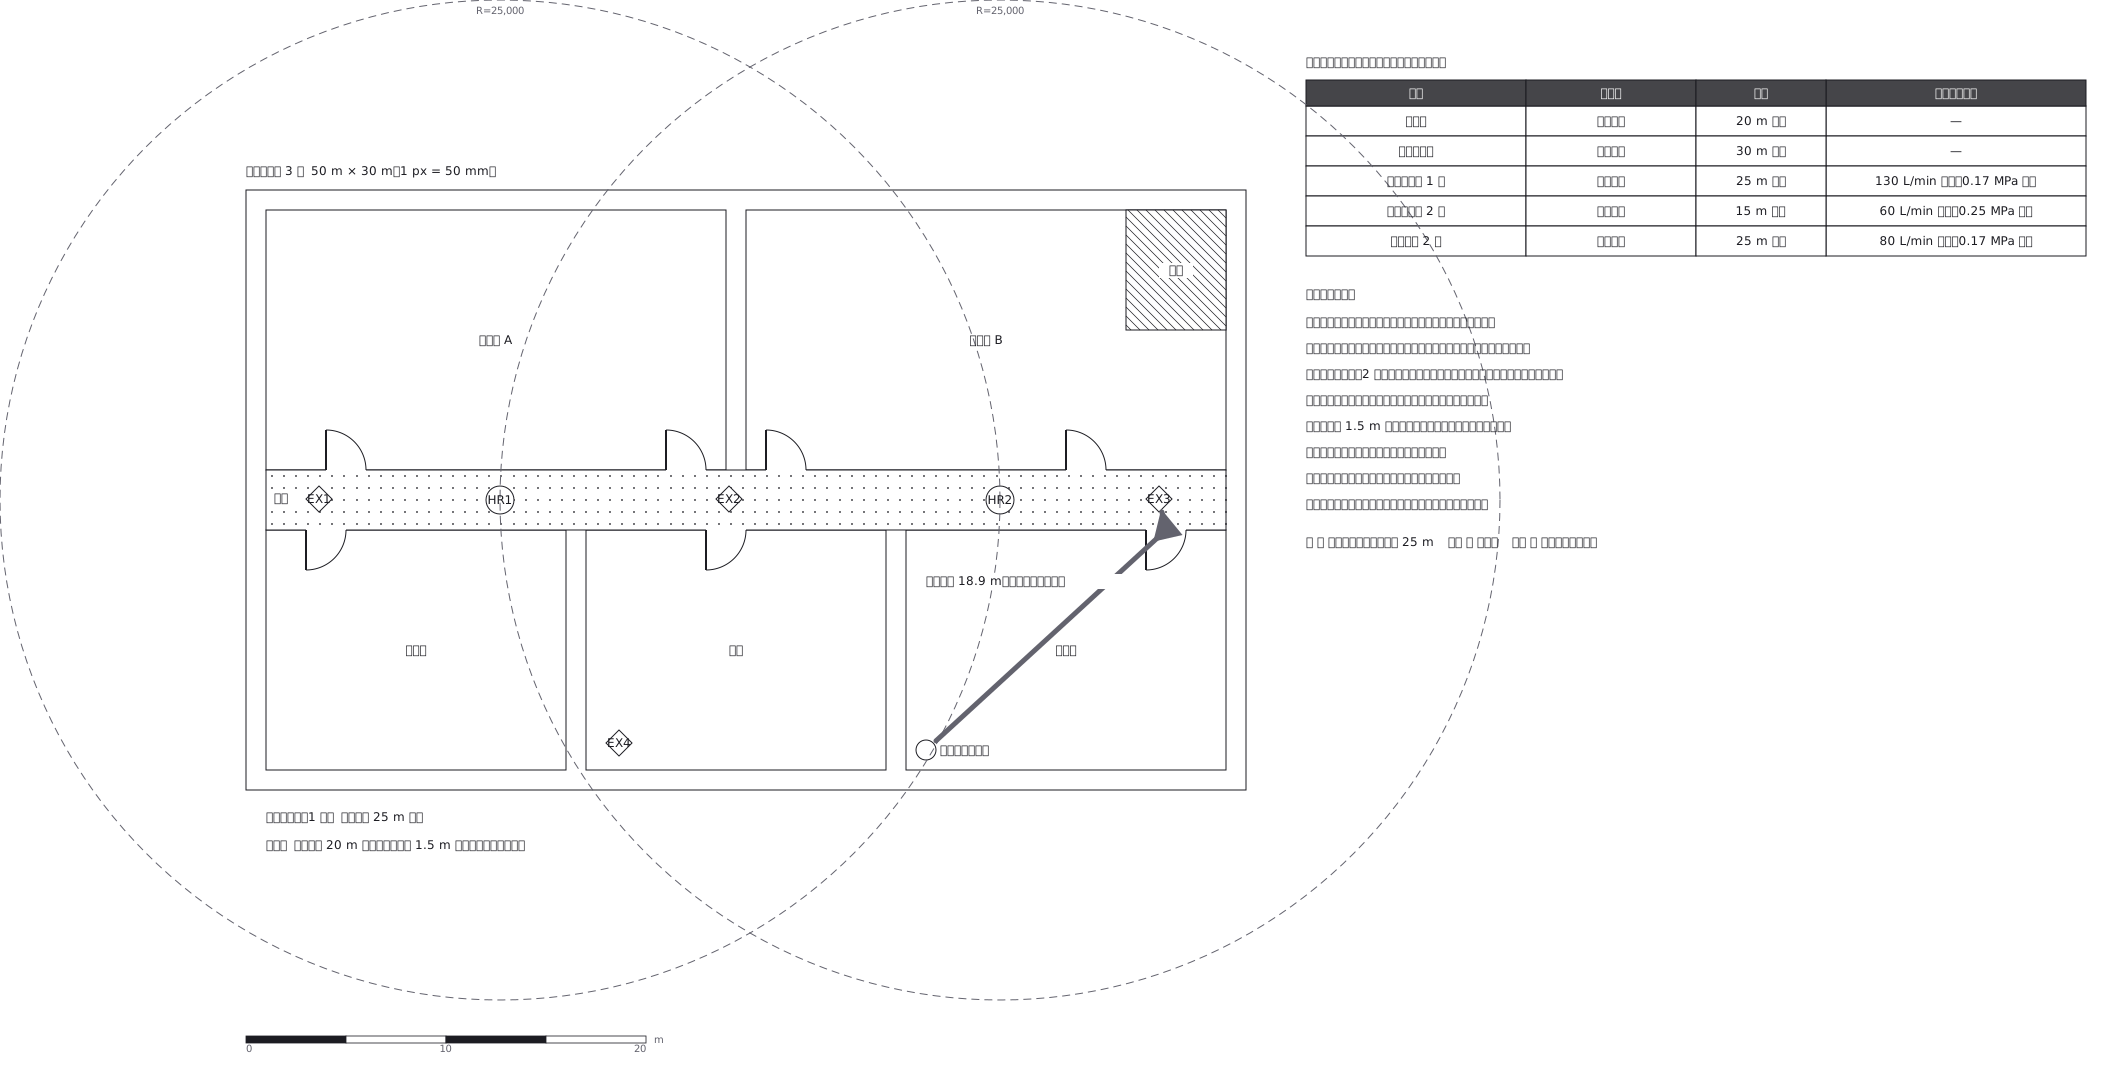 Extinguishers and hose reels, measured two different ways
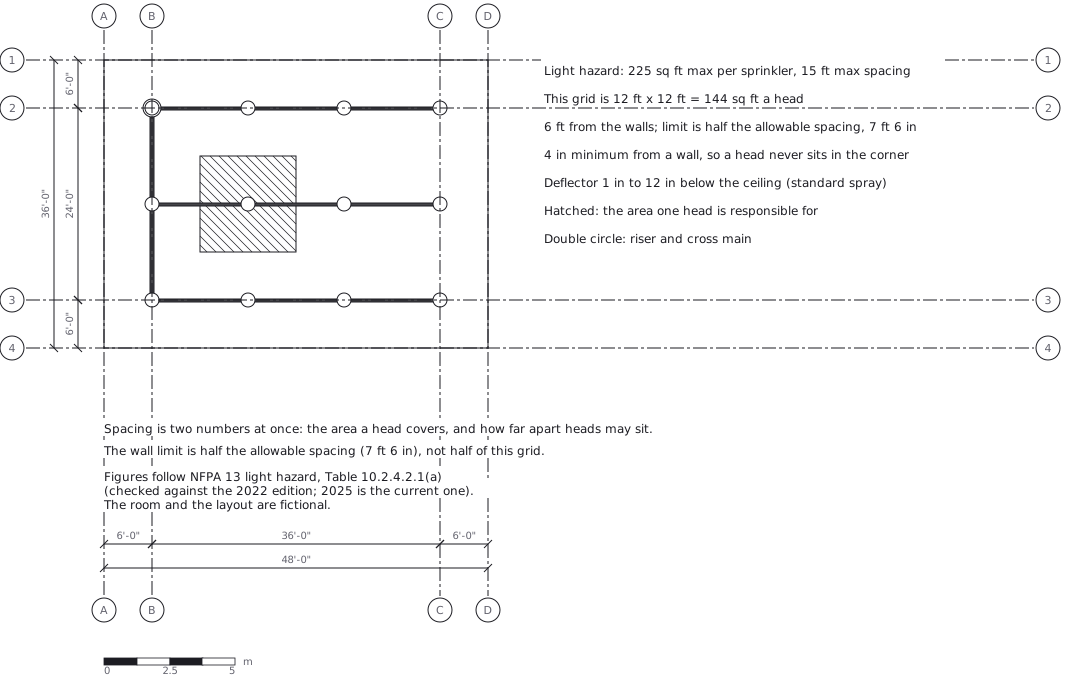 Sprinkler layout: area per head and spacing, decided together
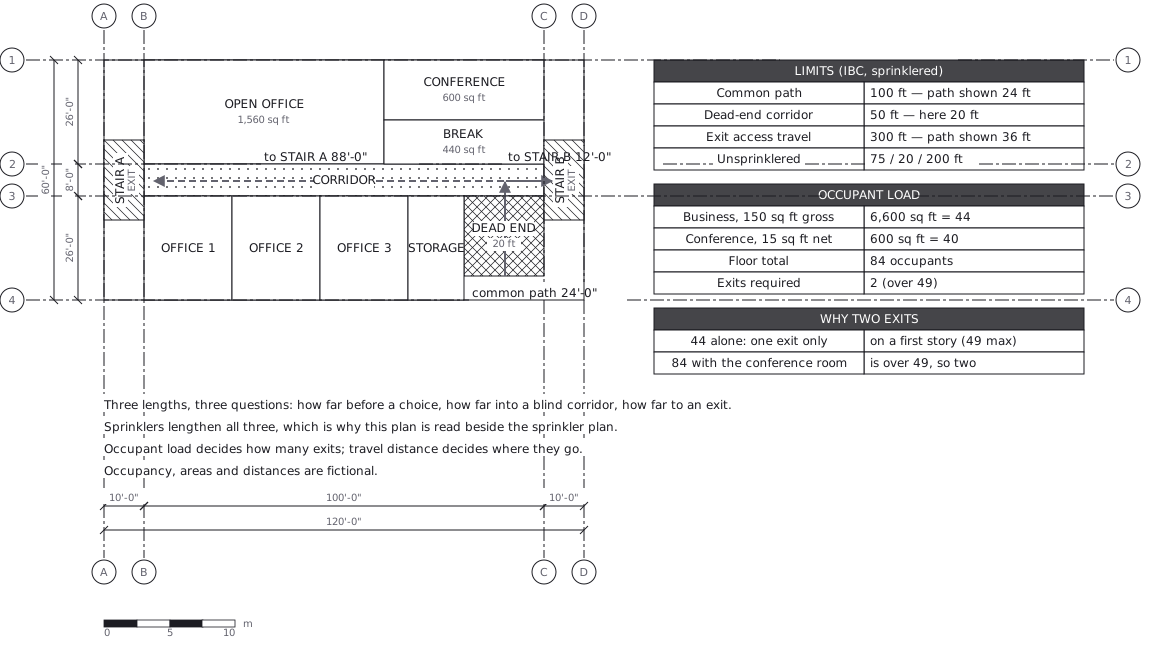 Egress plan: three lengths answering three questions
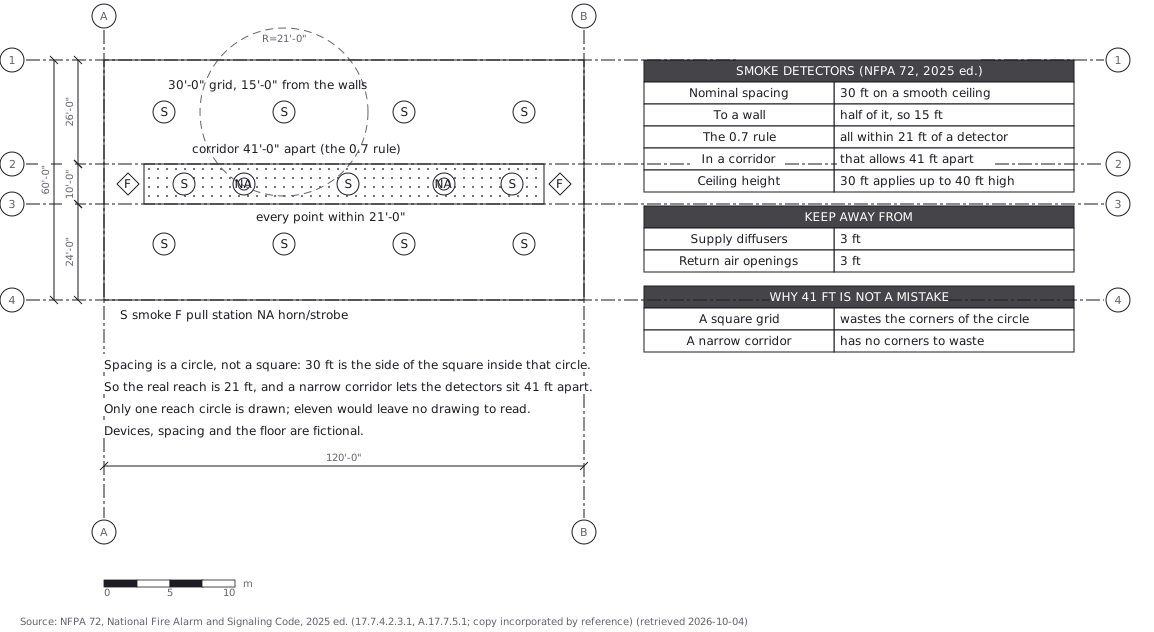 Fire alarm devices: spacing is a circle, not a square